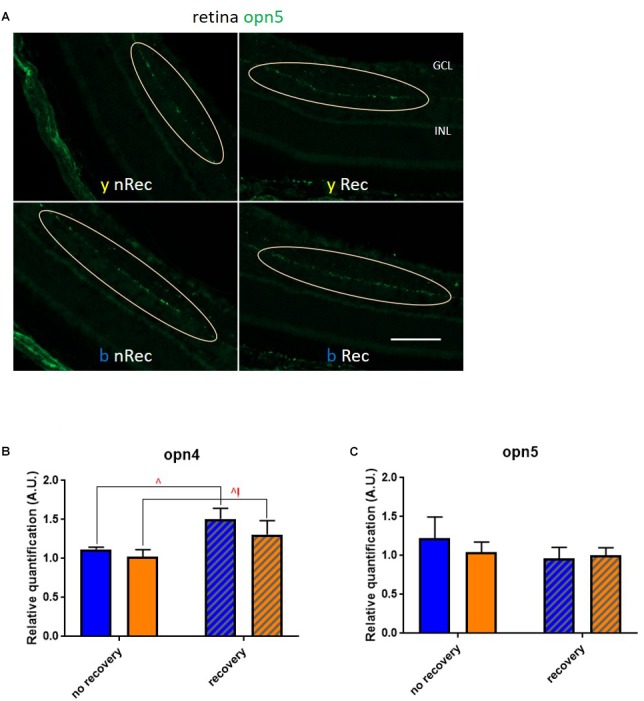
FIGURE 8.

Role of retinal photoreceptors (2). (A) Immunohistochemistry was performed on the retinas of blue- (b) and yellow-exposed (y) mice either immediately after illumination (nRec) or in 3 days of recovery (Rec). Results of anti-opn5 (C, localization of neuropsin-expressing cells is circled) staining is presented. Magnification is 20×, scale bars corresponds to 100 μm. (B,C) Results of RT-qPCR analysis on the retinas: mRNA expression of opn4 (B; blue no recovery vs. recovery – q = 0.0174, p = 0.0166; yellow no recovery vs. recovery – q = 0.0499, p = 0.0951) and opn5 (C). Blue and yellow bars correspond to blue and yellow exposures, respectively; clear and hatched bars correspond to the time points of dissection, either directly after illumination (no recovery) or in 3 days of recovery (recovery), respectively. All data are presented as mean ± SEM. Differences were considered significant when p < 0.05 (∗/∧), p < 0.01 (∗∗/∧∧), p < 0.001 (∗∗∗/∧∧∧) or p < 0.0001 (∗∗∗∗/∧∧∧∧). Carets correspond to comparison of mice assessed directly after illumination to the ones assessed after 3 days of recovery, within the same spectra. Red color means increase and blue color decrease in values.
