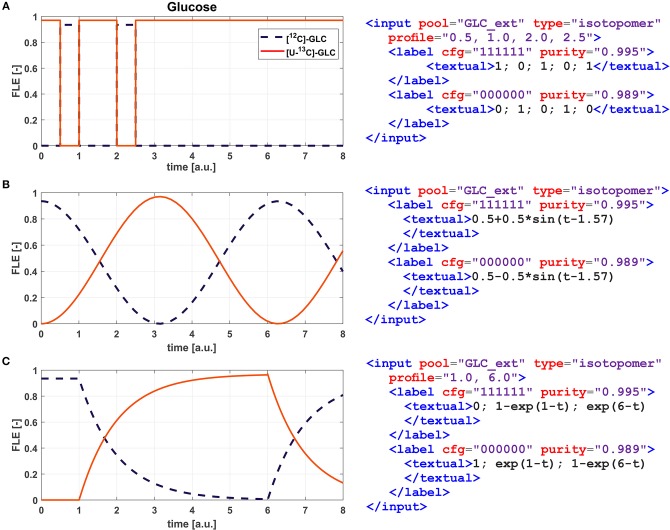
Figure 5.
Isotopic substrate labeling profiles. Showcased are a simple repetitive switch between fully (red solid line) and naturally labeled glucose (blue dashed line) specified via a Boolean condition for each time interval (A), a sinus with wavelength 2π (B), and an exponential enrichment-decay curve (C). Shown are fractional labeling enrichments (FLE). The species of each input pool must sum up to 1.0 to define a valid profile. Contributions attributed to impurities are not displayed in the charts.

