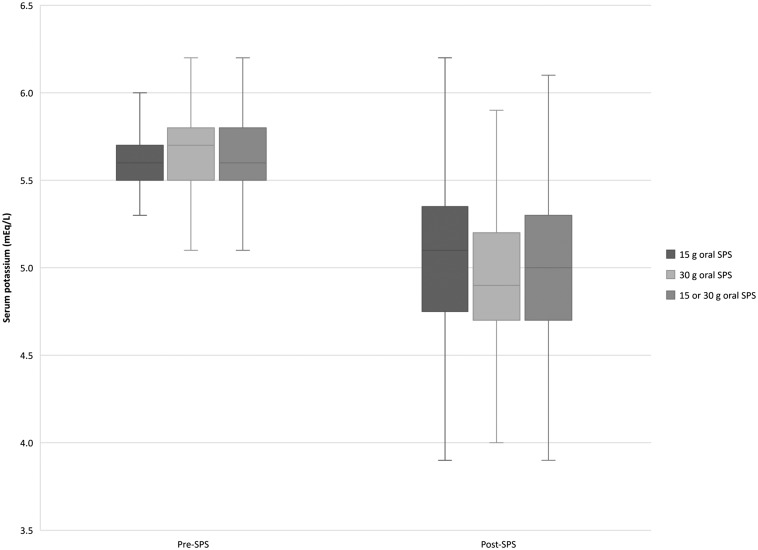
FIGURE 2.
Efficacy. Serum potassium pre- and post-SPS therapy by dose. Data are presented as box-and-whisker plots, in which the horizontal lines within the rectangles indicate the 50th percentile. The top and bottom of the rectangles indicate the 75th and 25th percentiles, respectively. The lines above and below the rectangles indicate Q1 or Q3 + (1.5 × IQR), respectively.

