
Figure 7.
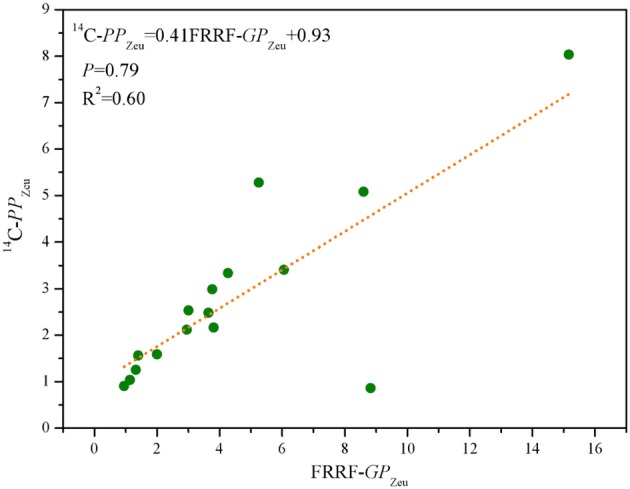
Scatter plots of FRRF-GPZeu and 14C-PPZeu [mg C (mg chla)−1 h−1 m−2] for pooled data of 16 stations in the BOB.
Official websites use .gov
A
.gov website belongs to an official
government organization in the United States.
Secure .gov websites use HTTPS
A lock (
) or https:// means you've safely
connected to the .gov website. Share sensitive
information only on official, secure websites.
Scatter plots of FRRF-GPZeu and 14C-PPZeu [mg C (mg chla)−1 h−1 m−2] for pooled data of 16 stations in the BOB.