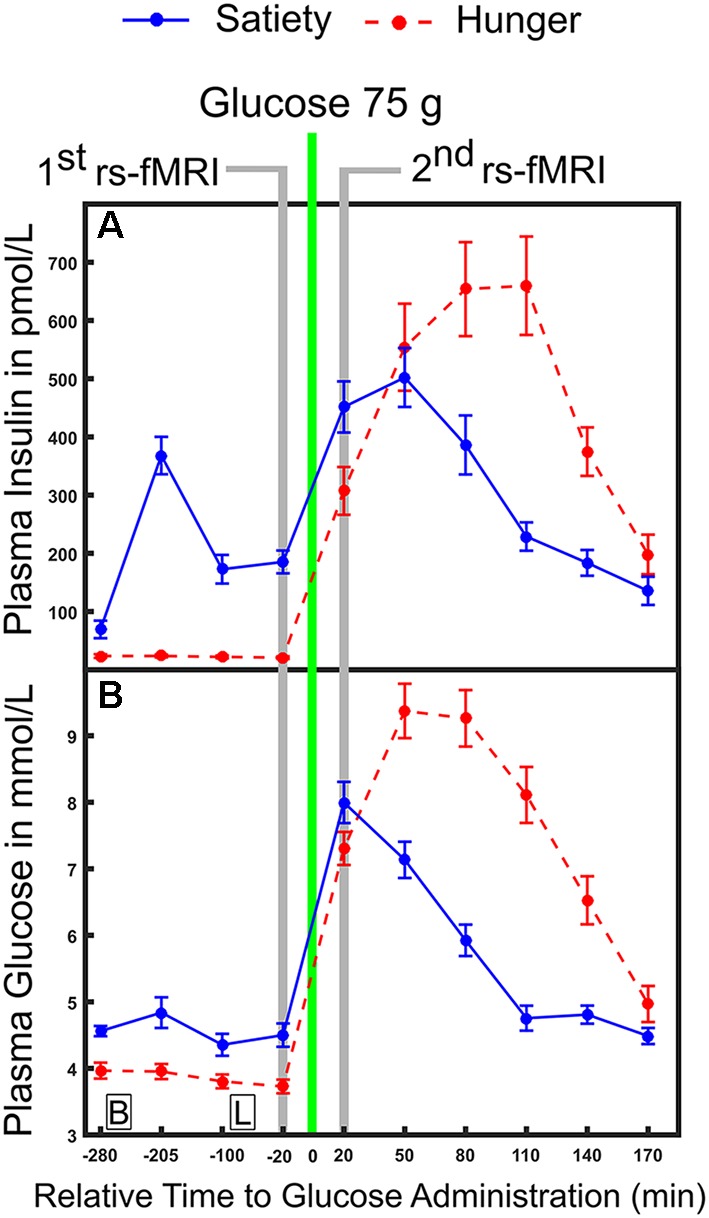
Figure 1.

Time course of physiological parameters under hunger and satiety conditions. (A) Mean plasma concentration of insulin and (B) glucose under hunger and satiety conditions. Glucose was ingested at time point 0. The time-points of the first and second functional magnetic resonance imaging (fMRI) investigations are marked in gray. Boxes on the bottom of the graph indicate the time points of meals on the second day (B, breakfast; L, lunch at 09:00 am and 12:00 pm, respectively). The error bars represent the standard deviation.
