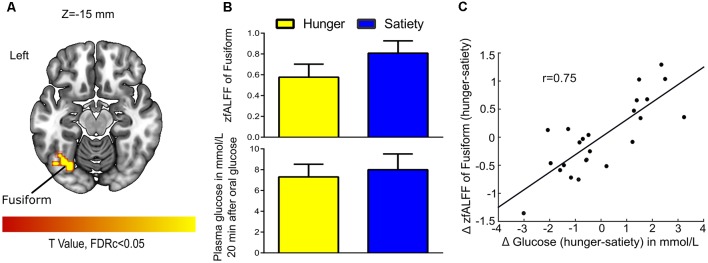
Figure 6.
Glucose-associated low-frequency BOLD fluctuations. (A) The Δ (hunger-satiety) of fALFF in Fusiform connected with Δ glucose plasma after glucose administration. The statistical image was assessed for cluster-wise significance using a cluster defining threshold P < 0.001, 0.05 false discovery rate (FDR) corrected at the cluster level. (B) Amplitude of BOLD signal in the fusiform gyrus and plasma glucose levels in the hunger and satiety states. (C) The LOOCV showed that a positive correlation (r = 0.75) between the average Δ fALFF value of fusiform cluster and Δ plasma glucose, adjusted for Δ plasma insulin level. LOOCV, leave-one-out cross-validation.

