
Extended Data Figure 8 |. p53 protein transduces stress signalling from mother to daughter cells.
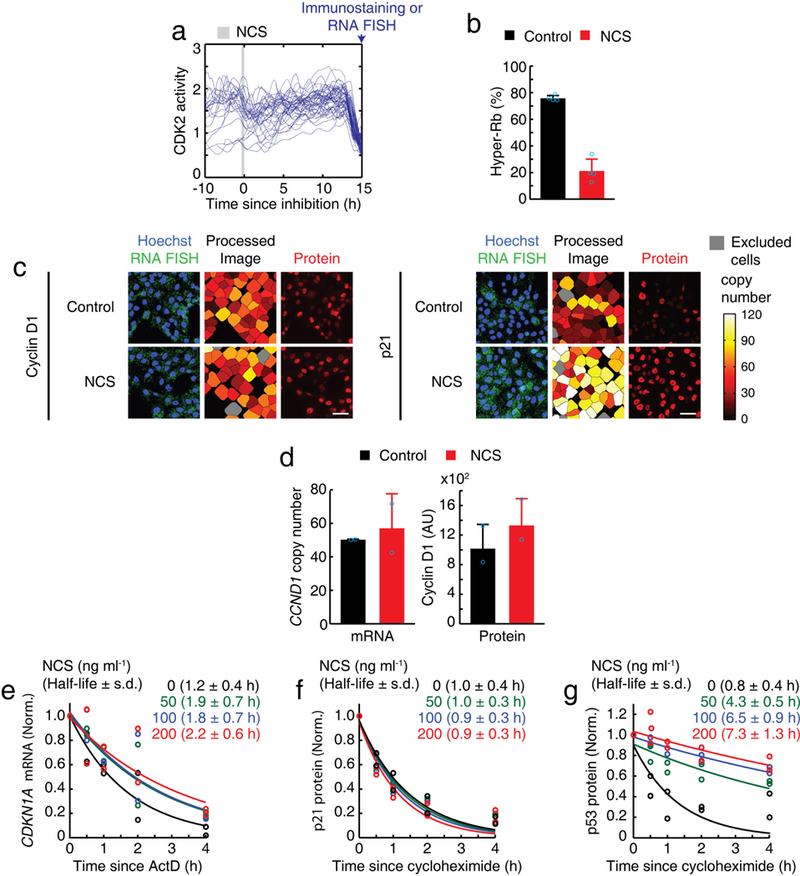
a, Individual traces of CDK2 activity showing the time window when a 20-min NCS pulse (200 ng ml−1) (marked in grey) was applied to mother cells. Cells that were fixed during the first 2 h after mitosis were selected. b, Percentage of hyper-Rb (Ser807/S811). Data are mean ± s.d. (n = 4 biological replicates). c, Representative images of cyclin D1 (CCND1) mRNA and protein levels, and p21 (CDKN1A) mRNA and protein levels after a 20-min pulse of NCS. Scale bar, 50 μm. d, mRNA and nuclear protein levels of cyclin D1 in G1 phase after exposure of mother cells to a 20-min pulse of NCS (200 ng ml−1). Data are mean ± s.d. (n = 2 biological replicates). e-g, Expression levels of nuclear p21 (CDKN1A) mRNA (e) and protein (f), and p53 protein (g), normalized by initial level (time 0 h). Cells were treated with either cycloheximide (10 μg ml−1) or ActD (5 μg ml−1), within 1 h of the application of the 20-min pulse of the indicated concentration of NCS (n = 2 biological replicates).