
Extended Data Figure 2 |. Characterization of ERK sensor and classification of CDK2 paths.
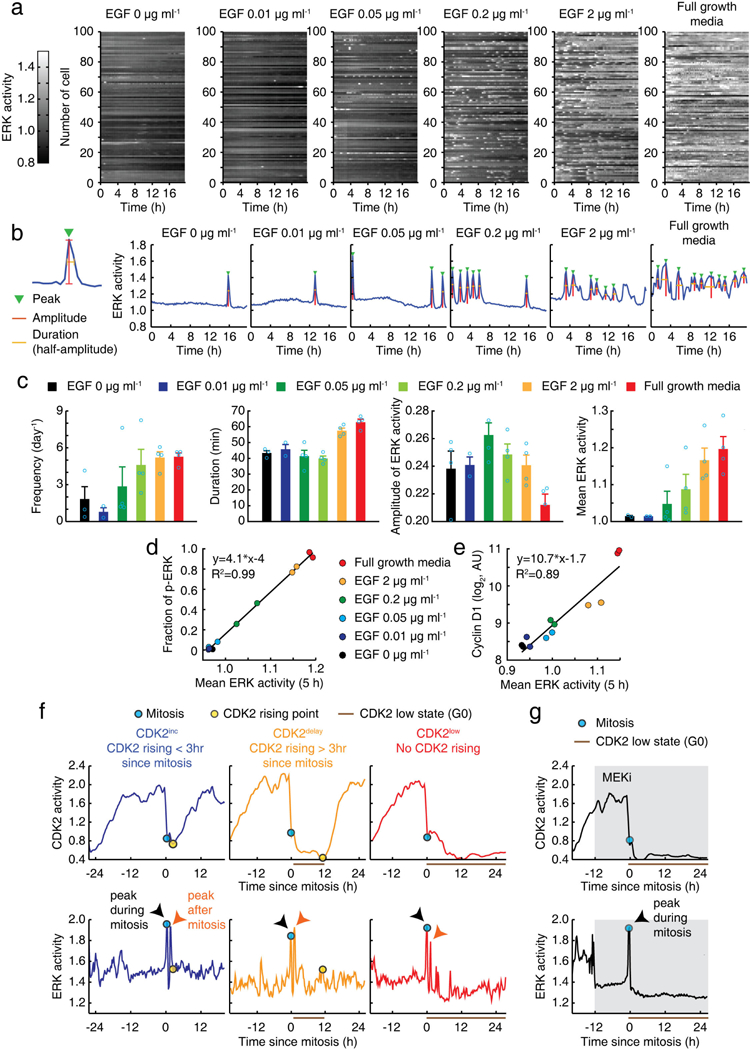
a, Representation of ERK activity time courses at different concentrations of mitogens. b, Examples of single-cell time courses of ERK activity. Automatic detection of indicated features of ERK activity. c, Averaged ERK features shown in b. MCF10A cells expressing ERK sensor were monitored for more than 18 h. Data are mean ± s.e.m. (n = 4 biological replicates). d, e, Correlation between ERK activity, integrated over 5 h, and the fraction of nuclear ERK phosphorylation (d) or the levels of nuclear cyclin D1 protein (e). f, Examples of CDK2 and ERK single-cell traces classified by CDK2 paths. g, Single-cell traces of CDK2 and ERK activity in response to inhibition of MEK (PD0325901; 100 nM) showing that a peak of ERK activation during mitosis was not suppressed by MEK inhibition.