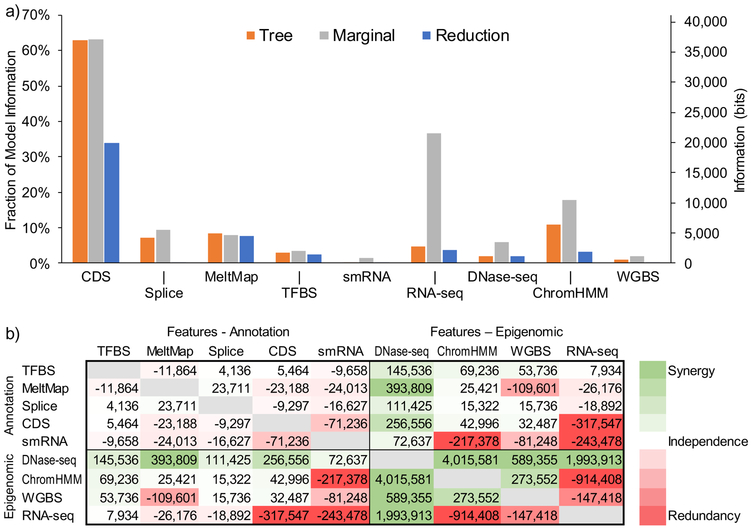
Figure 3. Information and synergy.
(a) Information about natural selection is attributed to each individual genomic feature by three methods: (1) summing over the associated decision rules in the tree (tree, orange); (2) measuring the information of the feature in isolation (marginal, gray); and (3) measuring the reduction in total information when that feature is excluded from the complete tree (reduction, blue). These measures are similar when a feature is largely orthogonal to other features (e.g., MeltMap) but different in the presence of strong correlations with other features (e.g., RNA-seq, ChromHMM). All estimates are based on log likelihoods computed from genome-wide data (Methods). (b) Synergy between all pairs of features measured as the excess in information obtained by considering a pair of features together relative to the information obtained by considering the two features separately (Methods). Each cell gives a value in bits. Cells are colored on a spectrum from red (large negative values, indicating redundancy) to green (large positive values, indicating synergy). Note that the matrix is symmetric.

