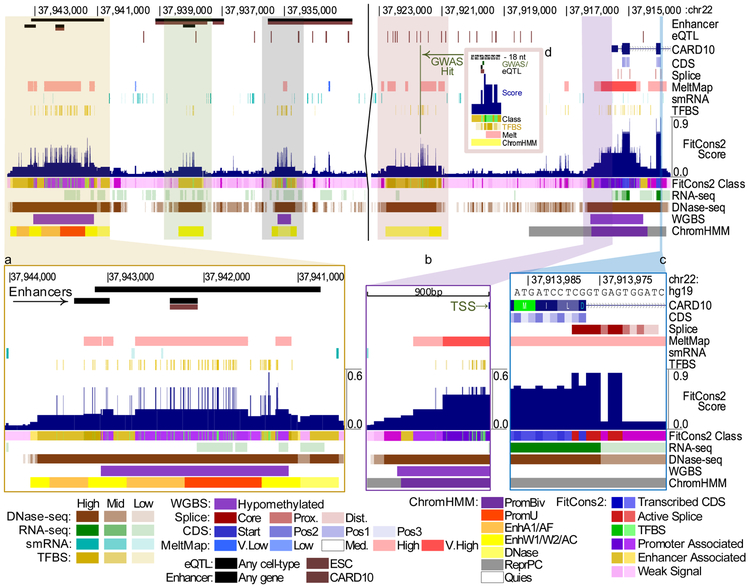
Figure 5. Genome Browser display.
UCSC Genome Browser display for a region of chromosome 22 overlapping the 5’ end of the gene encoding caspase recruitment domain-containing protein 10 (CARD10), which participates in apoptosis signaling and activates NF-KB via BCL10. FitCons2 scores (dark blue, near middle) are shown for the ES-WA7 (embryonic stem cell from blastocyst) cell type. Annotation features are shown above the FitCons2 scores and cell-type specific epigenomic features are shown at bottom. For reference, predicted enhancers from EnhancerAtlas23 (longer bars) and FANTOM524,25 (shorter bars; in both cases, brown indicates enhancers specifically associated with CARD10), eQTL from GTEx26 (brown indicates specific association with CARD10), and the gene annotation from GENCODE27 (top) are also shown. Insets show zoomed-in displays of (a) an apparent cluster of enhancers showing a high DNase-seq signal, ChromHMM states suggesting regulatory activity (orange: enhancer; red: promoter), and a high concentration of TFBSs; (b) the core promoter and transcription start site showing similar indications of regulatory activity; (c) a 5’ splice site and adjoining CDS and intronic sequences; and (d) GWAS and eQTL hits coinciding with a TFBS. Additional examples are shown in Supplementary Figures 5–7. A more detailed legend is provided in Supplementary Figures 8–9.

