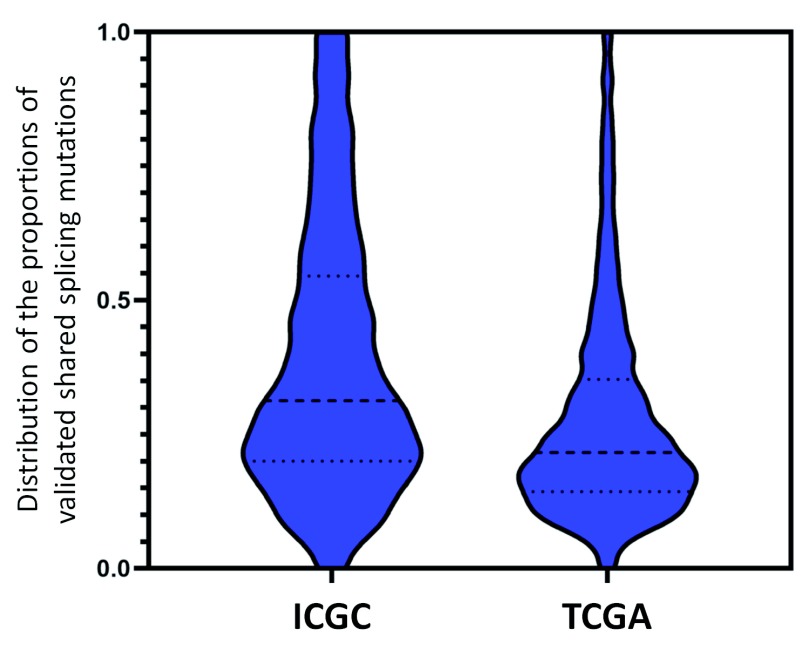
Figure 2. Census of Recurrent Splicing Mutations Present in Multiple ICGC and TCGA Patients.
Predicted splicing mutations present in multiple tumors from the same dataset that cause splicing abnormalities were analyzed to determine validation rates, since such variants were less subject to technical artifacts, such as sequencing errors. Violin plots indicate the distributions of the fraction of predicted and validated splicing mutations present in multiple patients relative to the total number of tumours carrying those mutations in the TCGA and ICGA datasets. To achieve statistical significance (95% C.I.), distributions of 1,379 validated variants shared by both datasets and present in at least 9 ICGC (left) and 24 TCGA (right) patients were compared. A higher overall proportion of mutations are validated in the ICGC dataset (average of 38.6% for ICGC and 27.8% for TCGA). The dashed lines in each plot indicate the median (middle line), the upper and lower quartiles of the mutation fractions.

