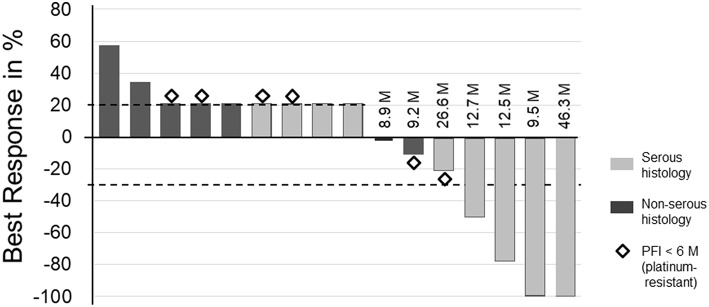
Figure 2.
Best overall response from baseline per patient. The waterfall plot displays the best responses of 16 patients according to the RECIST version 1.1. The progression-free survival (PFS) duration (M, months) after trial agent administration are presented for each patient who achieved a complete response, partial response, or stable disease for ≥4 M. Diamonds indicate tumor responses in patients with a progression-free interval (PFI) <6 M prior to enrollment. Gray bars indicate patients with serous histology, and black bars indicate patients with non-serous histology. Patients with indicated 21% tumor increases either developed new tumor lesions, exhibited early tumor progression or withdrew early for other reasons. These patients were arbitrarily designated as having a disease progression of 21% or an actual tumor progression of 21%.

