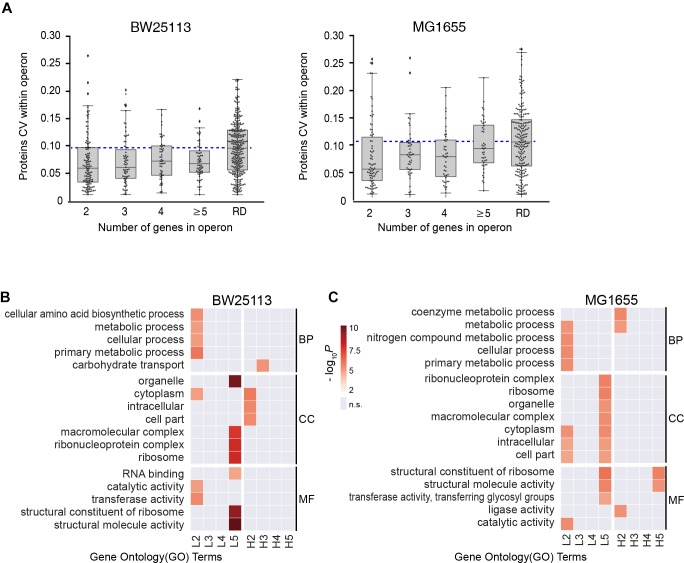
FIGURE 3.
Functional-dependence of operon stoichiometry control. (A) Protein CVs within operons, categorized according to the number of genes in operon. RD, randomized data. Blue dashed line represents the median of the randomized data. (B,C) Gene ontology (GO) overrepresentation of the operons with lower CV than the randomized median (L2–L5) and higher CV than the randomized median (H2–H5). The number refer to the number of genes in operon. GO terms with P > 0.001 were considered insignificant and marked as gray. BP, biological process; CC, cell component; MF, molecular function. (B) BW25113 and (C) MG1655 strain.

