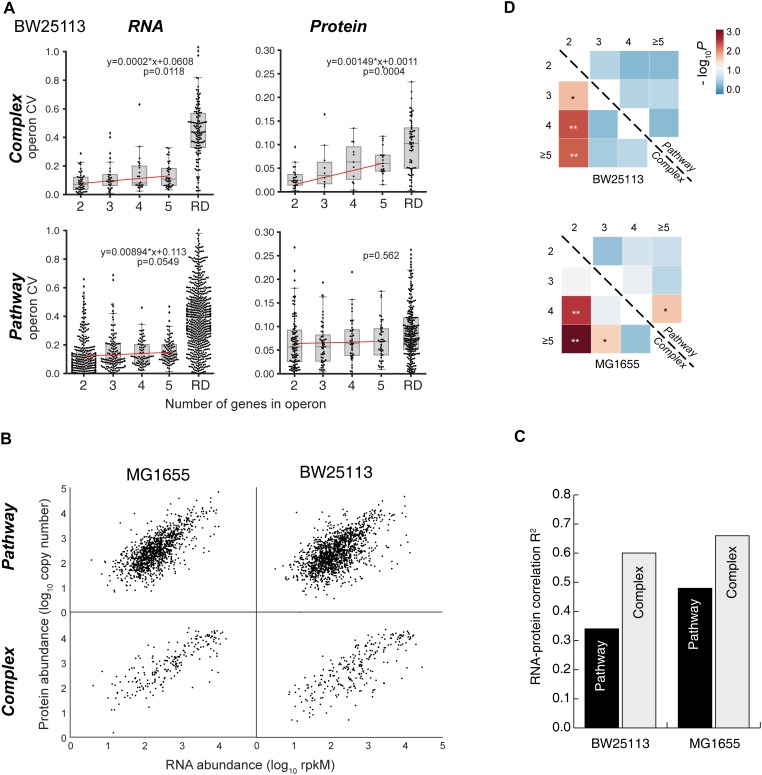
FIGURE 4.
Length-dependence of operon stoichiometry control. (A) Linear regression analysis of gene CVs at RNA and protein levels within operon that encodes proteins forming complexes or involving in the metabolic pathways in BW25113 strain. P-values of the regression are indicated in the plots. P < 0.05 are considered significant. RD, randomized control. (B) The RNA–protein scatter plots of the gene expression levels of the “Complex” and “Pathway” operons in two strains, respectively. (C) The correlation coefficient R2 of the RNA–protein correlation shown in (B) panel. (D) The mutual P-value (Mann–Whitney U test) matrix of the protein CV within “Pathway” operons and “Complex” operons, respectively. ∗P < 0.05; ∗∗P < 0.01.

