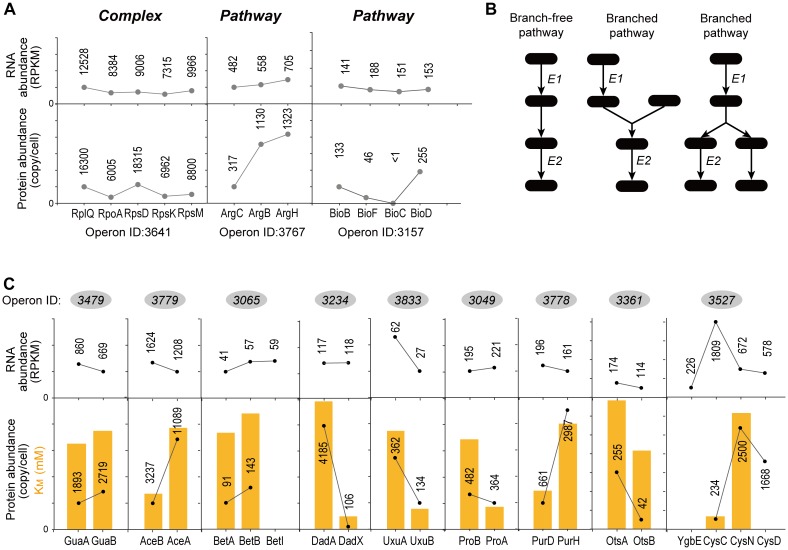
FIGURE 5.
Examples of “Complex” and “Pathway” operons. (A) The gene expression at RNA and protein levels in E. coli K-12 MG1655 strain. The detailed expression level are marked on the data points. <1 means the expression level is too low to be confidently quantified. (B) Illustrations of the “branch-free” and “branched” pathways. E1 and E2 represent the quantified proteins in the same operon. (C) All nine operons which encodes enzymes that exist in branch-free pathways. Their RNA abundance, protein abundance and KM values were plotted. KM values are plotted in orange bars. Detailed KM values are listed in Table 1. Detailed pathways are illustrated in Supplementary Figure S6.

