. 2019 Apr 23;10(21):5435–5443. doi: 10.1039/c9sc00729f

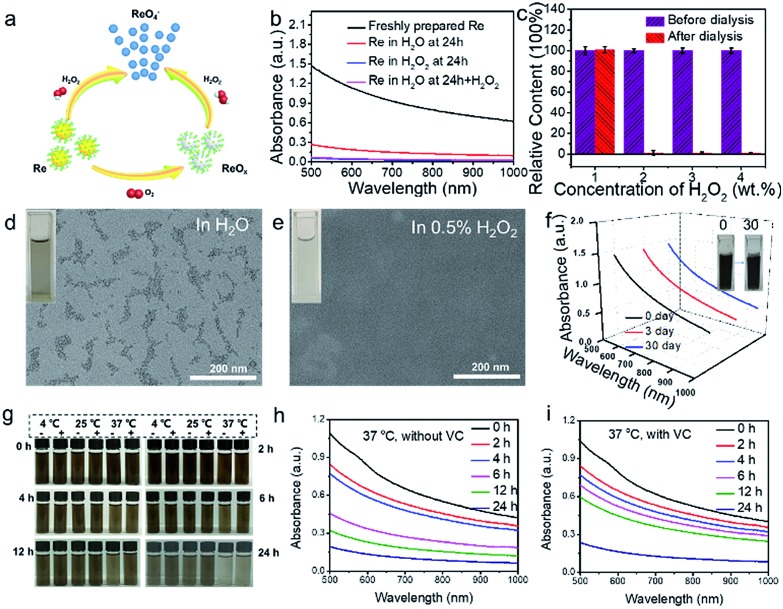
Fig. 2. H2O2-triggered degradation and storage stability of Re NCs. (a) Schematic of H2O2-triggered degradation. (b) Vis-NIR absorbance of Re dispersions treated with H2O or H2O2. (c) Relative Re content before and after dialysis. TEM images of the degradation product of Re NCs treated with H2O (d) or H2O2 (e). (f) Absorbance of Re NC dispersions stored at –20 °C for different time periods. Inset is the digital photograph of Re NC dispersions on the 0th and the 30th day. (g) Stability of Re nanocluster dispersions with (+) or without (–) vitamin C at different temperatures (4, 25, and 37 °C) for different time periods. (h and i) The corresponding vis-NIR absorbance of Re nanocluster dispersions with or without vitamin C at 37 °C for different time periods.

Fig. 2