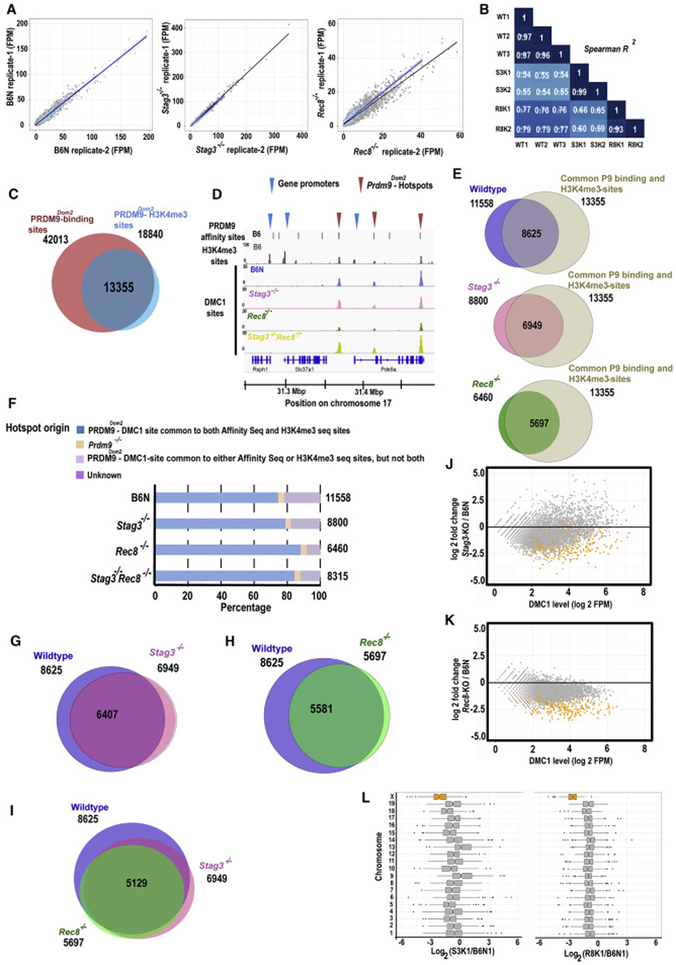
Figure 3. Cohesin subunit genes Stag3 and Rec8 are required for efficient DSB formation at PRDM9-activated hotspots.
(A) Scatterplots showing correlation between two replicates of the B6N (wildtype control), Stag3−/− and Rec8−/− DMC1-ChIP-seq samples. Read numbers are hotspot strength for each sample expressed in fragments per million (FPM). The black line indicates correlation between autosomal hotspots, and the blue line indicates correlation between X-linked hotspots.
(B) The correlation matrix illustrating hotspot strength for each sample estimated between common hotspots derived from the same and different genotypes of wildtype (WT) and mutant mice (S3K denotes Stag3−/− and R8K denotes Rec8−/− mutants respectively).
(C) Venn diagram showing common sites between PRDM9Dom2 binding sites from an affinity-seq experiment and PRDM9Dom2-dependent H3K4me3 trimethylated sites from a ChIP-seq experiment, both in wildtype B6J mice.
(D) Coverage profiles of DMC1 peaks from a representative genomic window on chromosome 17 for chromatin with the Prdm9Dom2 allele on a wildtype B6N background (blue), Stag3−/− (pink), Rec8−/− (green) and Stag3−/− Rec8−/− (yellow) spermatocytes. PRDM9 affinity binding sites (top black bars) and H3K4me3 peaks (gray) are shown in first two panels. Recombination hotspots were defined as the sites common for PRDM9 affinity binding and H3K4me3 marks (red arrow heads); gene promoters are characterized by H3K4me3 peaks alone (blue arrow heads).
(E) Venn diagrams showing overlap between DMC1 peaks and PRDM9Dom2 activated hotspots. Numbers outside circle denote the total number of PRDM9Dom2 hotspots and total number of DMC1 peaks. Number inside the circle indicates common genomic sites.
(F) Distribution of DMC1 peaks in B6N control, Stag3−/−, Rec8−/− and Stag3−/− Rec8−/− spermatocytes among PRDM9Dom2 hotspots, Prdm9−/− DSB sites, unclear and unknown sites. The total number of observed peaks is shown on the right-hand side of the graph.
(G & H) Venn diagrams showing overlap between DSBs sites at PRDM9Dom2-activated hotspots in pair-wise comparisons among wildtype (B6N), Stag3−/− and Rec8−/− spermatocytes. Numbers outside circle denote the total number of DMC1 peaks for respective genotypes. Number inside the circle indicates common DMC1 sites.
(I) Venn diagram showing the number of DSB sites at PRDM9Dom2 activated hotspots in common among wildtype (B6N), Stag3−/− and Rec8−/− spermatocytes. Numbers outside circle denote the total number of DMC1 peaks at defined PRDM9Dom2 hotspots for respective genotypes. Number inside the circle indicates common DMC1 sites between all three genotypes.
(J & K) MA-plots of hotspot strength measured by SSDS on autosomes (grey) and the X chromosome (orange) at PRDM9Dom2 activated hotspots (n=5129) in Stag3−/− and Rec8−/− spermatocytes in comparison to B6N (wildtype) control. P-values were calculated using Analysis of Variance (ANOVA) with Tukey's correction for multiple testing to determine the significance.
(L) Hotspot strength in Stag3−/− and Rec8−/− appear weak on chromosome X (orange) and most autosomes (grey) in comparison to wildtype (B6N) control. P-values were calculated using Analysis of Variance (ANOVA) with Tukey’s correction for multiple testing to determine the significance. The statistical analysis showing significant changes is reported in Data S2.
See also Data S2.

