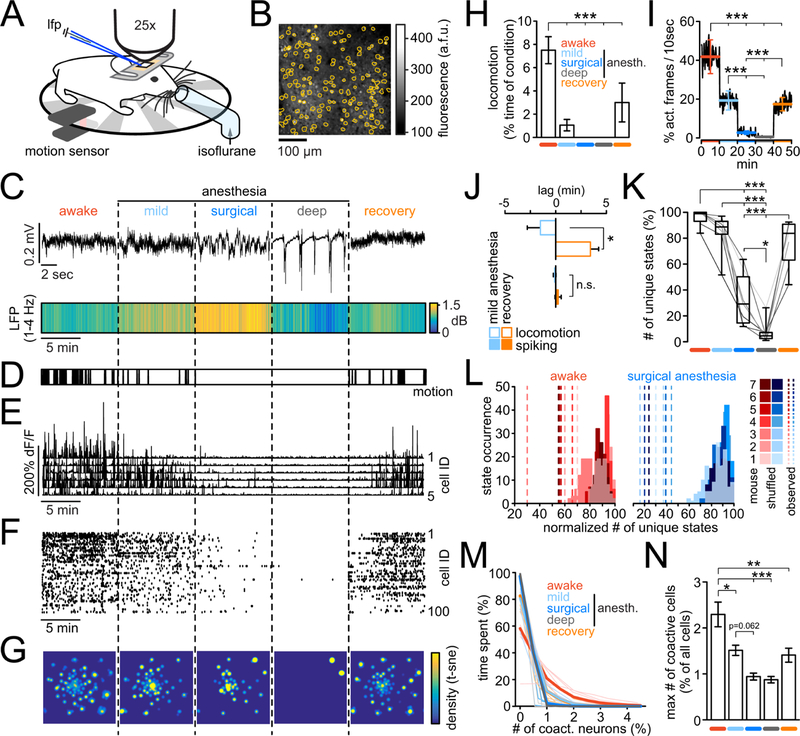
Figure 1.

Monitoring microcircuit signatures of mLOC in mice. A) Awake, head-restrained mouse on a running wheel. Locomotion was measured by an infrared sensor. For seamless transitions across conditions, isoflurane was delivered through a custom tube placed right in front of the mouse. For LFP recordings, a pulled glass microelectrode was carefully inserted into the cortex at around 250µm depth through a small burr hole next to an implanted glass cover. Through the glass, two-photon calcium imaging was performed. B) Image of typical field of view and registered neuronal somata outlines (orange). C) Upper panel: Representative brief raw LFP traces across five conditions. Lower panel: Avg LFP delta range [1–4Hz] spectral power across all five 10min long conditions (n=7 animals). Note the continuously increased delta power during surgical anesthesia. D) Superimposed locomotion of all 7 mice across conditions. Note that movement is absent in surgical and burst-suppression anesthesia. E) Calcium transients of 5 representative registered neurons across all five conditions. F) Corresponding raster plot of all registered neurons. G) Density map of microcircuit states, visualized by t-SNE for the entire experiment, displayed per condition. Vectors representing the population activity at each time point were transformed into a two-dimensional space while preserving local structures, and a density map was generated from the scatter plot. H) Quantification of locomotion across the entirety of each experiment (exp.), displayed as % locomotion per condition (10min each); anesth.=anesthesia. I) Neural activity level across conditions, quantified as probability of detecting activity within a moving 10sec window in a yes or no fashion; errorbars represent means ± s.e.m. per condition; conditions colored as in Fig. 1H) J) Relationship between LOC and neural activity during mild anesthesia vs. recovery. Shown are the mean lags (n = 7 mice) of events (motion or spiking) with respect to the first (5 min), and second half (5 min) of mild anesthesia, or recovery. If motion or activity were evenly distributed throughout conditions, mean lags would be 0. Note how locomotion consistently stopped in the first half of the mild anesthesia condition, while it re-emerged exclusively in the second half the recovery condition (−90.6 ± 77.6 sec vs. 205 ± 48.6 sec, Mann Whitney test [n=7]; p=0.0105). Importantly, in both conditions neural activity levels were much more evenly distributed across both conditions (−6.2 ± 7.8 sec vs. 14,2 −18,3 sec, Mann Whitney test [n=7]; p=0.62). K) Boxplots of number of unique microstates (t-SNE/WS) across conditions as % of all identified unique microstates in a given experiment; line plots are individual experiments (grayscale) L) Total number of observed unique microstates (dashed lines) during wakefulness (red) or surgical anesth. (blue) vs. corresponding distributions of values from 100 randomized datasets. (n = 7 mice, each exp. max-normalized for purpose of visualization). No overlap of observed vs. random data (p<0.01). M) Number of co-active neurons (in %, for purpose of visualization) versus the relative time spent by imaged population containing such co-activity, displayed per condition. Thick lines represent means, thin lines individual exp. conditions L) Maximum number of co-active neurons (as % of all neurons per exp.) participating in a specific microstate, across conditions (colors as in M). Borderline statistical significance mild vs. surgical anesthesia p=0.062. Figure 1 H–L show data from n=7 mice; all errorbars represent mean ± s.e.m.; all boxes in boxplots represent 25–75%ile of the data, bars within boxes represent means. Except comparison between observed and randomized data (1L), and comparison of two groups (1J), all statistical analyses represent 1way-anova with Bonferroni post-test. *p<0.05, **p<0.01, ***p<0.001.
