
Figure 2. Deletion of the Second Intracellular Loop of the 5-HT2CR Correlates with Reduced Susceptibility to Infection.
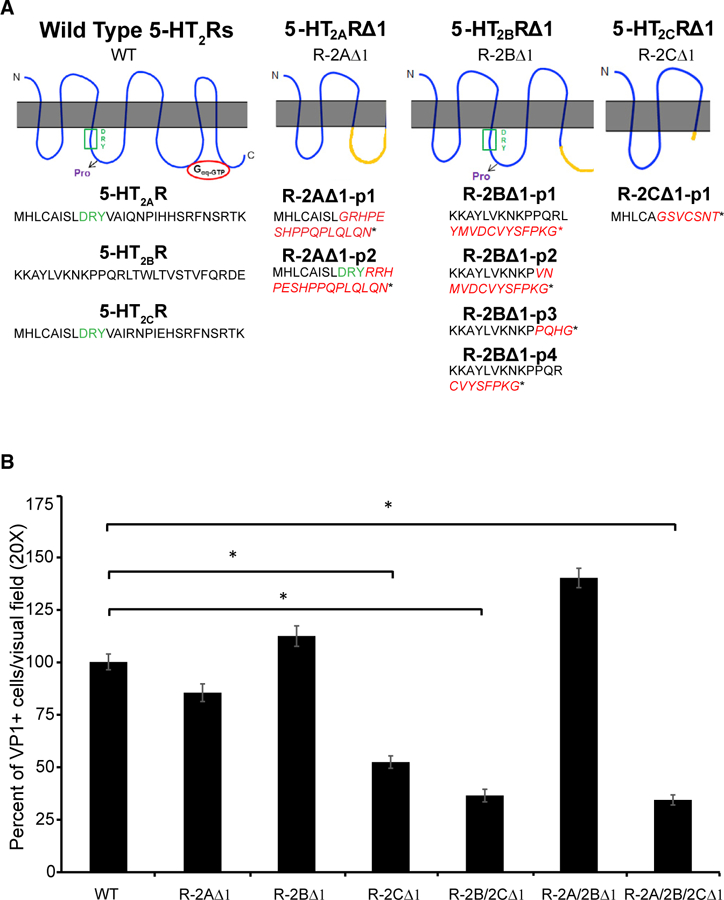
(A) The protein sequence of the 5-HT2AR∆1 (R-2A∆1), 5-HT2BR∆1 (R-2B∆1), and 5-HT2CR∆1 (R-2C∆1) compared to the WT is shown. Red letters highlight where the frameshift occurred, and the star indicates the stop codon.
(B) WT and genetically modified SVG-A cell lines were infected with JCPyV for 1 h at 37°c, and cells were stained for VP1. VP1-and DAPI-positive nuclei per visual field were quantified. Percent infection in WT SVG-A cells was set to 100% and the results normalized to this value. The results represent the average of three independent experiments performed in triplicate; at least 15 fields of view were imaged per replicate. Error bars represent SEM. *p < 0.05.
See also Figure S1.