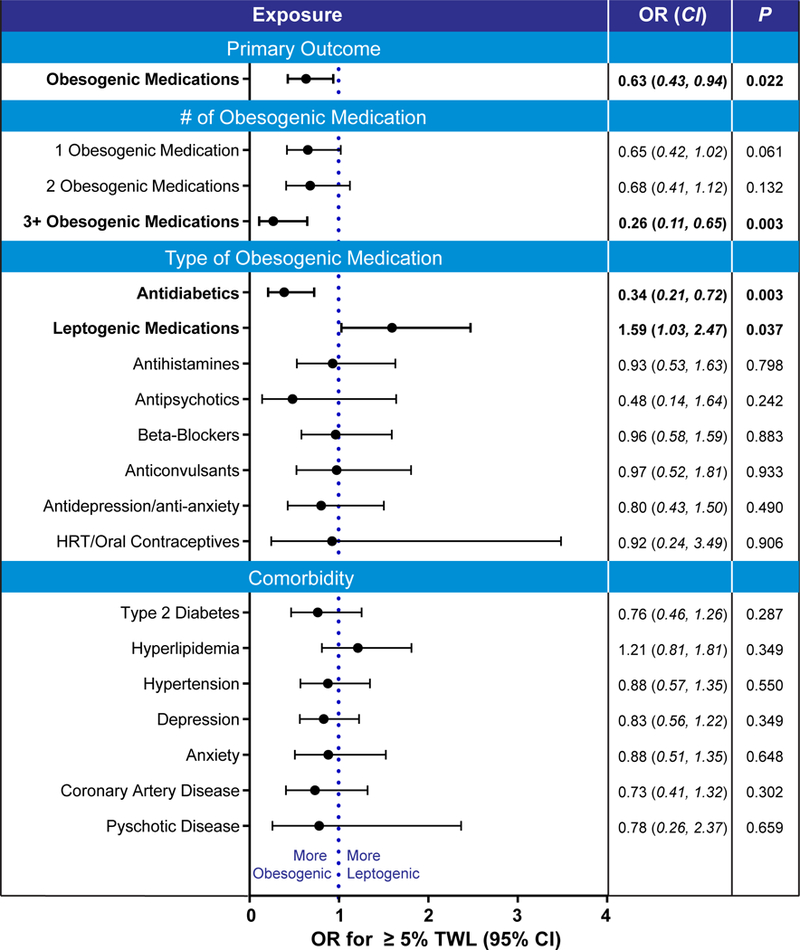
Figure 1: Factors associated with worse weight outcome at the end of the MOVE! program.

Odds ratio (OR) and 95% confidence interval (CI) of ≥5 percent total weight loss (%TWL) at the end of MOVE! program. P values from logistic regression adjusted for obesity pharmacotherapy and differences in baseline characteristics between responders and non-responders, including age, gender, obesogenic, Body Mass Index and leptogenic medications. Odds ration where P < 0.05 are in bold.
