
Figure 2. Postnatal Retinal Microglia Resemble Aging and Disease-Associated Microglia and CD11c+ Microglia of the Developing White Matter.
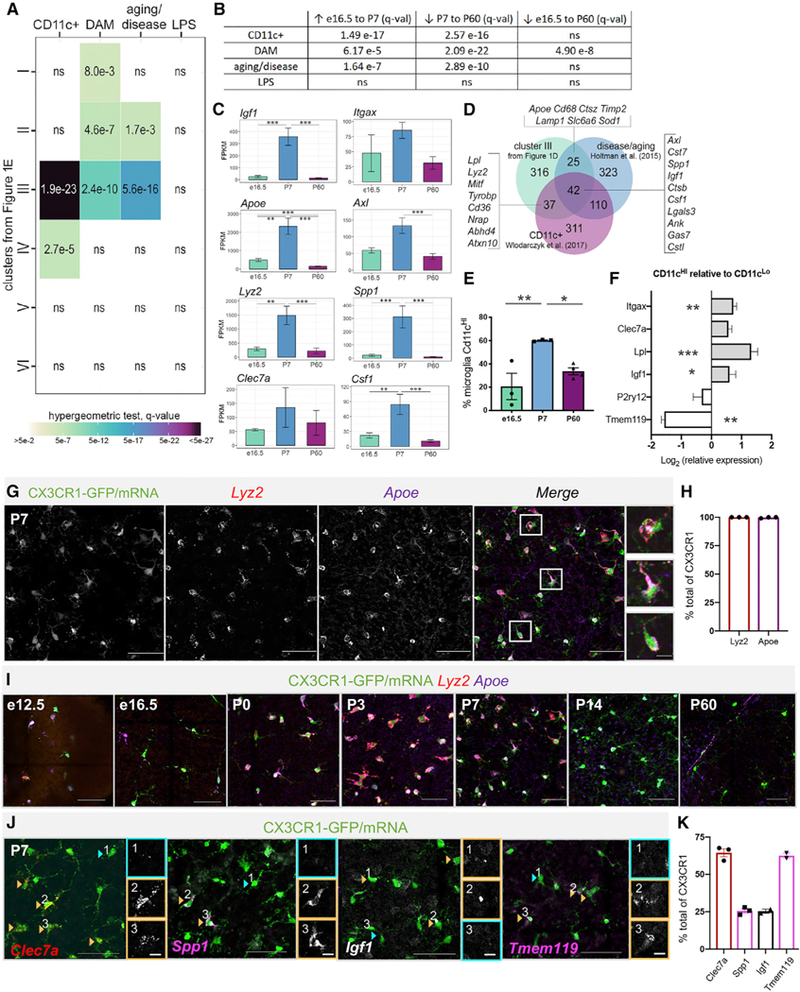
(A) Comparison by hypergeometric test of retinal microglia clusters (Figure 1E) with upregulated genes from published datasets.
(B) GAGE of top 500 upregulated genes from published datasets to all retinal microglia gene counts. ns= not significant.
(C) Mean FPKM ± SEM for genes overlapping with disease and aging datasets. *padj≤ 0.05, **padj ≤ 0.01,***padj≤ 0.001.
(D) Venn diagram of overlap between cluster III genes from Figure 1E, aging and disease genes, and CD11c+microglia of developing white matter.
(E) Average percentage of Cd11cHImicroglia (CD45+GFP+) at e16.5, P7 and P60 by flow cytometry (±SEM; n = 3 each, 2 retinas/sample); One-way ANOVA F(2,7) = 9.714, p = 0.0096 and Tukey’s multiple comparisons. *p ≤ 0.05,**p ≤ 0.01.
(F) Log-transformed relative gene expression in CD11cHI versus CD11cLo microglia from the same samples by qPCR. (±SEM; n = 5). Two-tailed paired t test *p ≤ 0.05, **p≤ 0.01, ***p ≤ 0.001.
(G) Max projected confocal image of HCR wholemount P7 retina. Scale bar, 50 µm. Inset scale bar, 10 µm.
(H) Percent CX3CR1-GFP+ cells expressing Apoe and Lyz2 by HCR (±SEM; n = 3 each).
(I) Max projected confocal images of HCR at e12.5, e16.5, P0, P3, P7, P14, and P60. Scale bar, 50µm.
(J) Heterogeneous expression by HCR of Clec7a (red), Spp1 (pink), Igf1 (white), and Tmem119 (pink) in Cx3cr1 expressing cells (green) at P7. Orange arrowheads and boxes indicate high expression and blue, low or no expression. Scale bar, 50 µm. Insets are individual channels without Cx3cr1; scale bar, 10 µm.
(K) Percent of CX3CR1-GFP+ cells expressing each gene by HCR (±SEM; n ≥ 2).