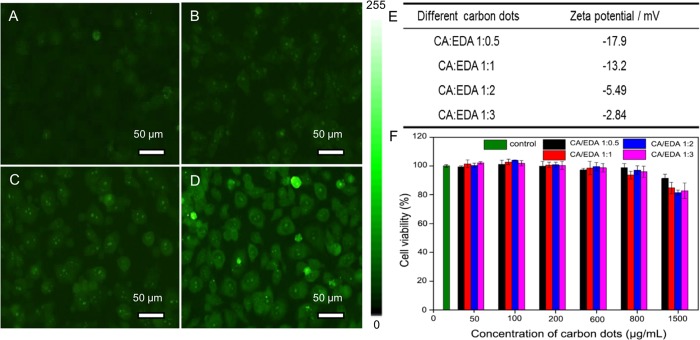
Fig 2.
Fluorescent images of HeLa cells incubated with 400 μg/mL of carbon dots with the molar ratio of CA: EDA at 1:0.5(A), 1:1 (B), 1:2 (C), 1:3 (D) for 24 h (under blue light excitation). Table of the Zeta potentials of carbon dots with different molar ratio of CA: EDA (E). Viability of HeLa cells incubated with various carbon dots with different concentrations for 24 h (F).

