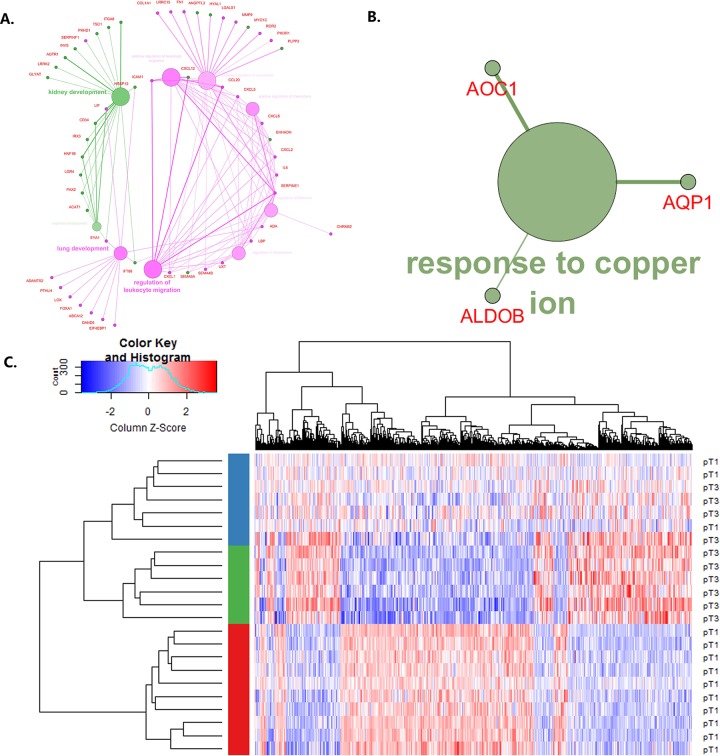
Fig 1. Results of differential expression analysis performed on T3 vs. T1 samples.
A. Pathway enrichment comparison performed in ClueGO plugin for Cytoscape software on 481 differentially expressed genes from T3 vs. T1 comparison. Green–downregulated, pink–upregulated genes; the size of the node is inversely proportional to the term p-value. B. Pathway enrichment performed in ClueGO plugin for Cytoscape on gene set with LogFoldChange > |1.5| and adjusted p value < 0.05. C. Heatmap of differentially expressed genes in T3 vs T1 comparison. Based on the expression pattern the samples were divided into three clusters. Color bar indicates what cluster the sample was assigned to: red–A1 (pure T1), green–A3 (pure T3), blue–A2 (mixed).

