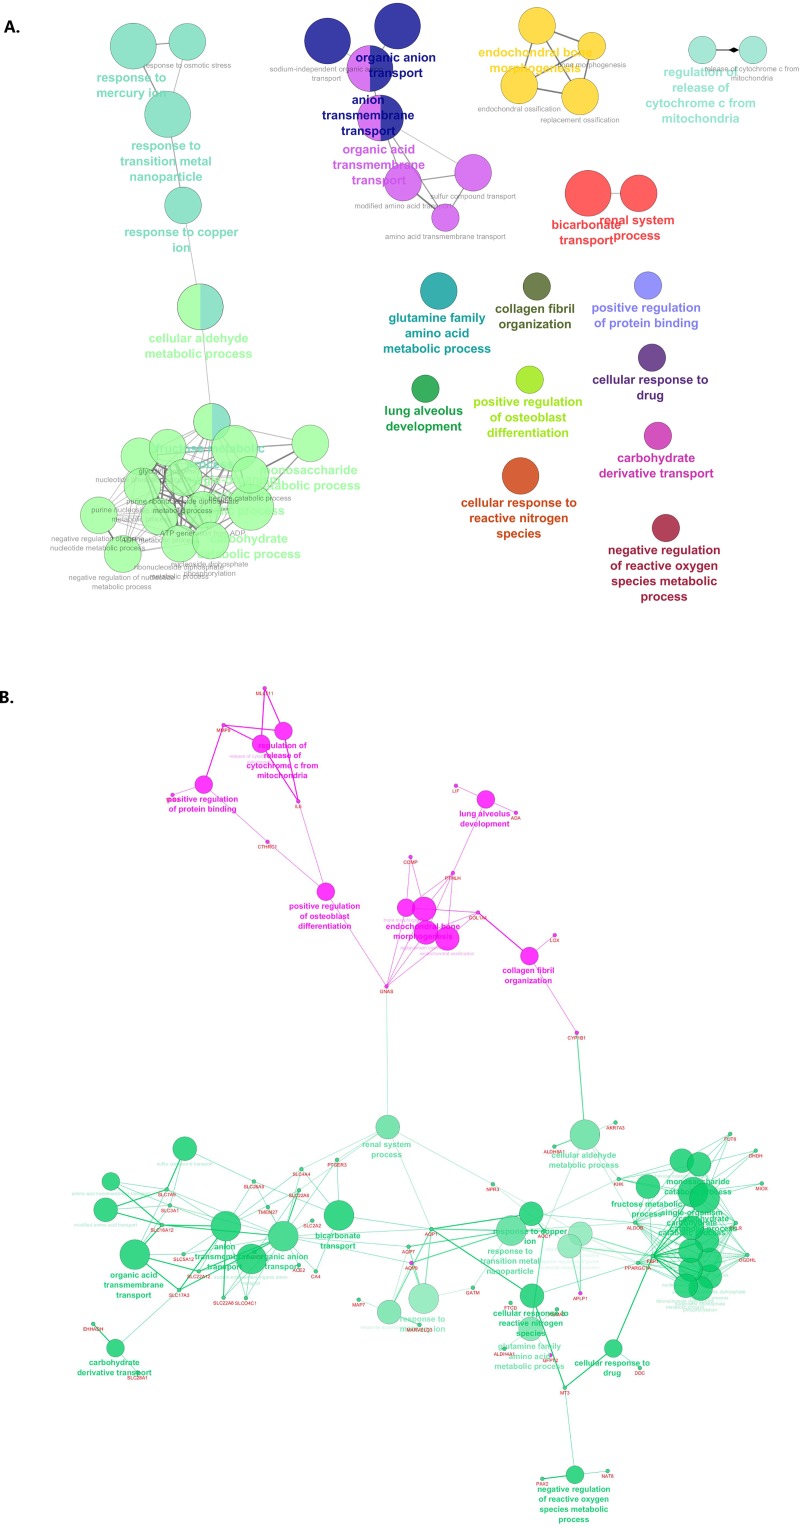
Fig 3. Results of pathway enrichment analysis performed in ClueGO (plugin for Cytoscape software) for A3 vs A1 comparison.
A. GO interaction pathway with genes from A3 and A1 initial clusters. B. Indication whether the genes associated with given biological process were up- or down- regulated. Green—GO's associated with down-regulated genes, pink—GO's associated with up-regulated genes.

