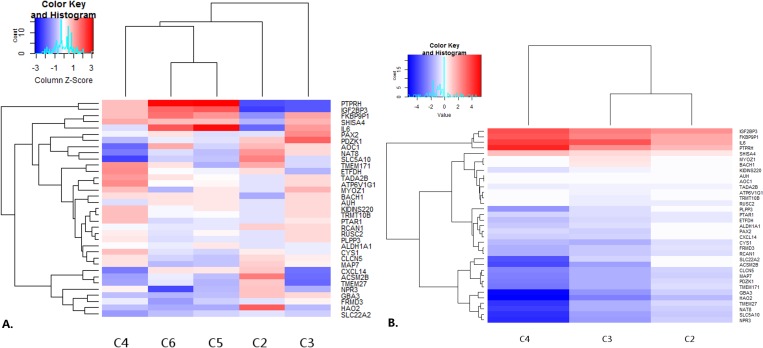
Fig 5. Results of Renyi divergence analysis performed on T1 and T3 data from TCGA database.
Gene set resulting from comparisons of three presented clusters were used as an input for clustering method. Next differential expression was calculated in comparison to the largest cluster obtained. Heatmaps show logFoldChange of selected gene set. A. Clusters of T1 samples, B. clusters of T3 samples.

