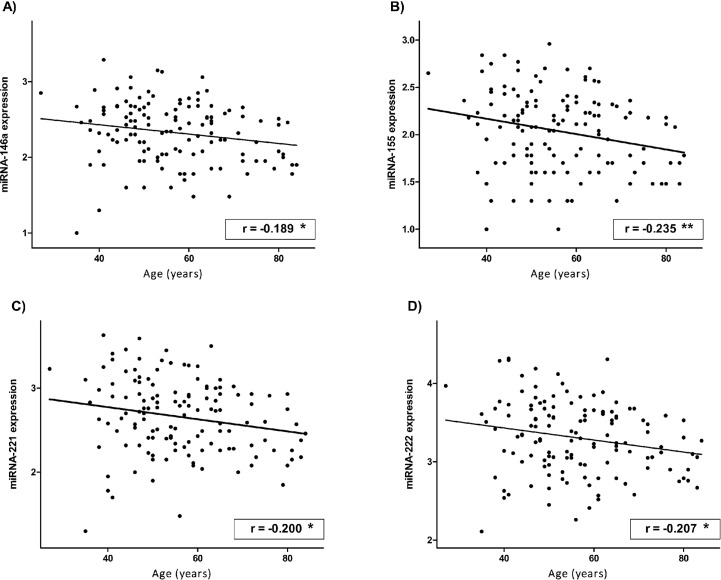
Fig 2.
Correlations of the expression of miRNA-146a (A), -155 (B), -221 (C) and -222 (D) in blood of BC patients with age at diagnose at pre-RT control. miRNA expression was calculated as log(2-DCt)+3. Pearson correlation coefficient (r) is shown. -means inverse correlation. *means significant differences at p<0.05 (bilateral). **means significant differences at p<0.01 (bilateral).

