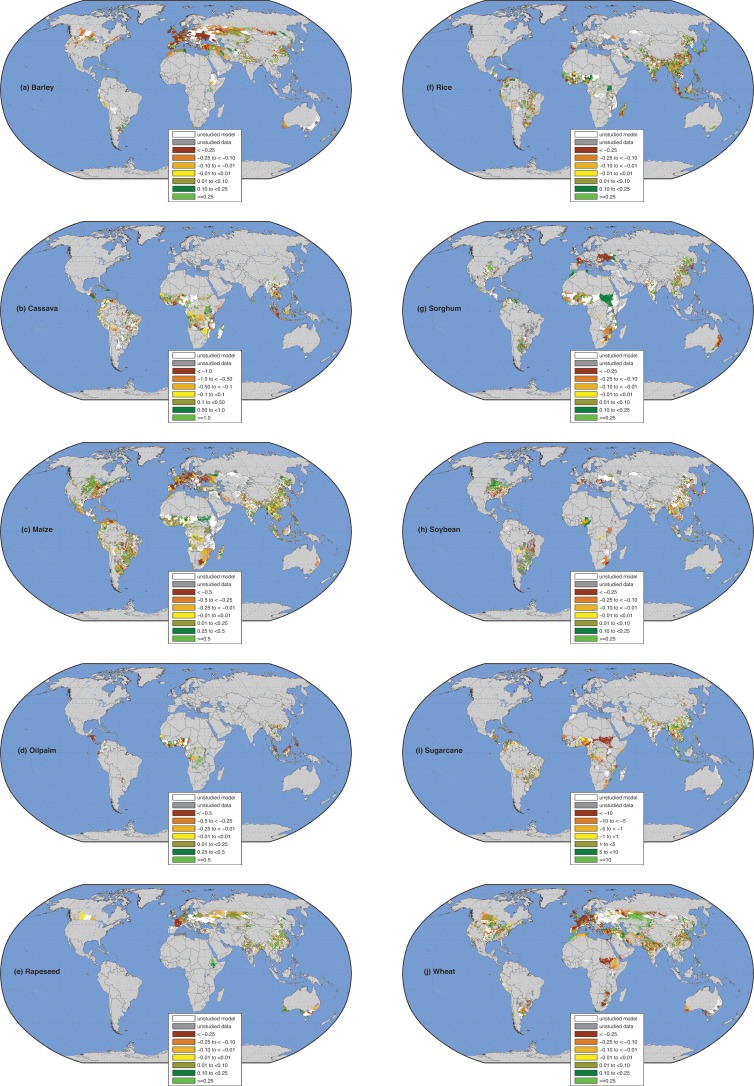
Fig 1. Impact of mean climate change on crop yield (tons/ha/year).
Brown colors denoted reduction in yield and green colors indicate gains in yield due to mean climate change. (a) barley; (b) cassava; (c) maize; (d) oil palm; (e) rapeseed; (f) rice; (g) sorghum; (h) soybean; (i) sugarcane; and (j) wheat. White areas are where the study was not conducted due to model (unstudied model) and dark gray areas are where the study was not conducted because of data (unstudied data). Light gray areas are where we do not have any report of the crop being harvested or the crop is insignificant and is mapped as background color in land areas. Oceans, seas, large lakes, and large water bodies are mapped in blue color.

