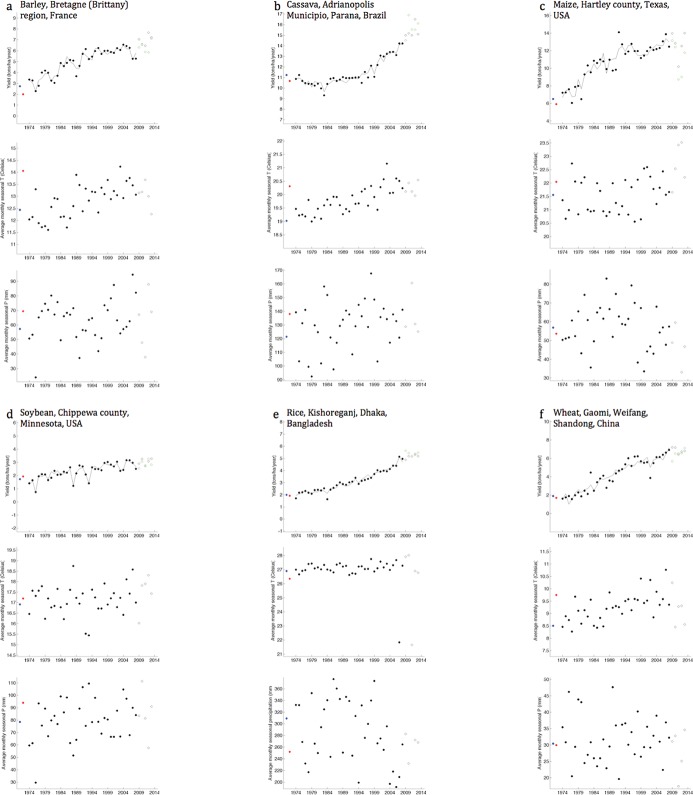
Fig 2. Six examples showing construction of the regression model relating observed yield (top panels) to the independent variables (middle and bottom panels–only the seasonal average observation is plotted) for example crops and political units (filled black circles) over 35 years 1974 to 2008.
The models were then used for predicting yields for historical (filled blue circles) and current (filled red circles) climate conditions with time terms switched off as we are only interested in the difference to yield from difference in climate. Out-of-sample predictions do not occur as the historical and current conditions are bounded within the training weather conditions (middle and bottom panels for seasonal conditions). Yield predictions for individual years 2009 to 2013 (out of sample) are shown in open green circles and observed yield in open black circles with 5 year average error reported as follows for the specific political unit (noted in the figure) in a country: (a) barley (France) -9.3% error, (b) cassava (Brazil) 2.4% error, (c) maize (USA) -13.3% error, (d) soybean (USA) -5.3% error, (e) rice (Bangladesh) 18.4% error, and (f) wheat (China) -6.2% error.

