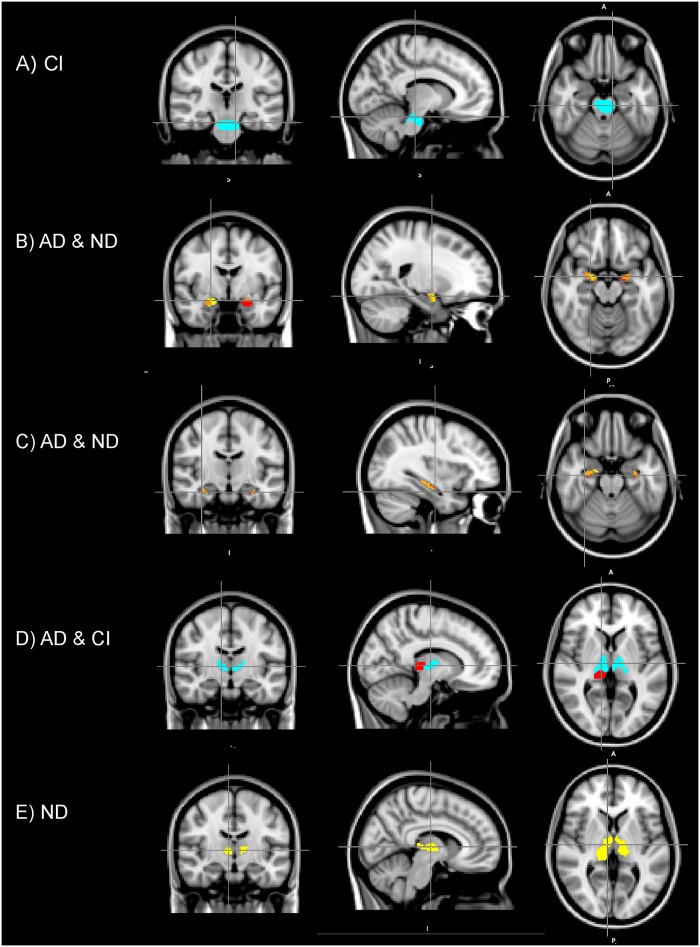
Fig 2. Results of the voxel-wise group analysis.
Brainstem (A), the amygdala (B), the hippocampus (C) and the thalamus (D, E). Images display clusters of voxels where group differences are significant (p<0.05). Here, CI and AD were increased, and ND was decreased in the patient group in the respected clusters. A) The cluster in the brainstem where CI were increased. C) AD (red) compared with ND (yellow), overlapping regions of significance (orange). D) AD (red) compared with ND (yellow) and joint (orange) C) AD (red) and CI (magenta), no overlapping voxels. D) ND (yellow).

