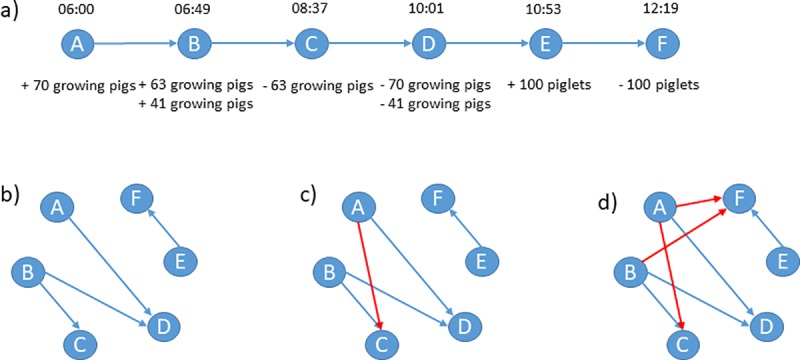
Fig 2. Example of transport data.

(a) Time path of the transport data of one tour operated by a single truck. The tour starts at 6.00 a.m. at farm A where 70 pigs are loaded. It then continues to farm B where another 104 pigs are loaded. At farm C, some of the pigs from farm B are unloaded. After that, the truck continues to farm D where the pigs from farm A and the rest of the pigs from farm B are unloaded. The tour ends at 12.19 p.m. with a transport of 100 piglets from farm E to farm F. (b) The network corresponding to the direct transports between farms neglecting the transport sequence. (c) By taking the transport sequence into account, an additional edge between A and C is added because animals from farm A may transmit a disease to C via animals from B. (d) By assuming that the truck can be contaminated and transmit a disease even further, we must include another two edges between A and F and B and F.
