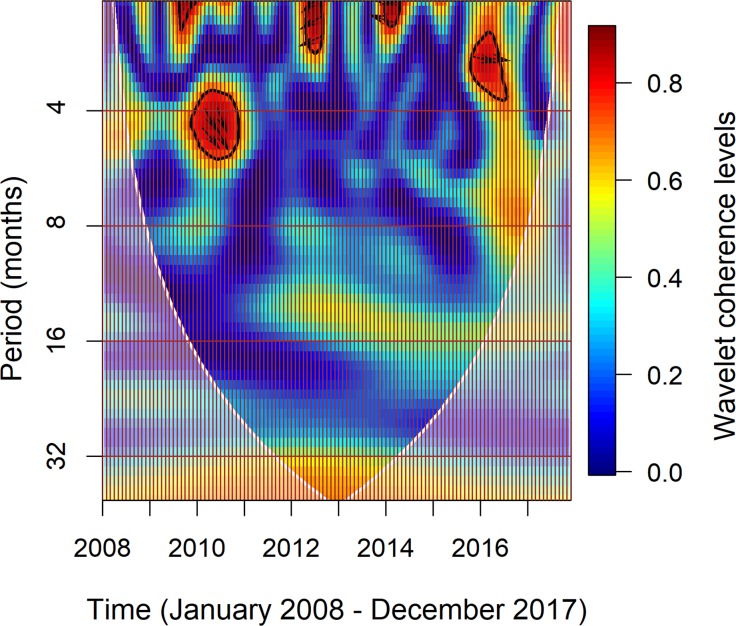
Fig 6. Squared wavelet coherence between monthly imported CHIKV cases and 6-month lagged moving average SOI.
The vertical axis shows the frequency of wavelet coherence. The brown vertical grid lines indicate month of the year. The area below the white dashed lines is the ‘cone of influence’, where edge effects restrict the ability to explain the results (shown as a lighter shade). The dark red colour represents the higher correlation between them. The thick black contour designates the 5% statistical significance levels against red noise. The 5% significance levels determined using Monte Carlo methods (1000 Monte Carlo randomizations). Arrow denotes a specific phase relationship between monthly imported CHIKV cases and 6-month lagged moving average SOI.

