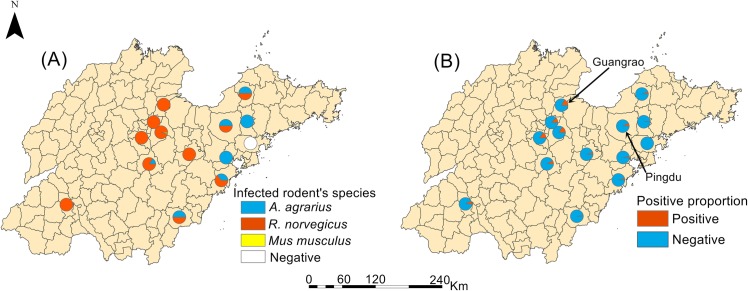
Fig 4. Spatial distribution of HV-infected rodents and the hantaviruses (HV) carriage rates in surveillance sites.
(A) After laboratory testing, the species of HV-infected rodents in each surveillance sites were sorted out and displayed by different color. (B) The infection proportions of rodents captured in each surveillance site were also displayed. The map was visualized with ArcGIS 10.2 software (ESRI Inc., Redlands, CA, USA).

