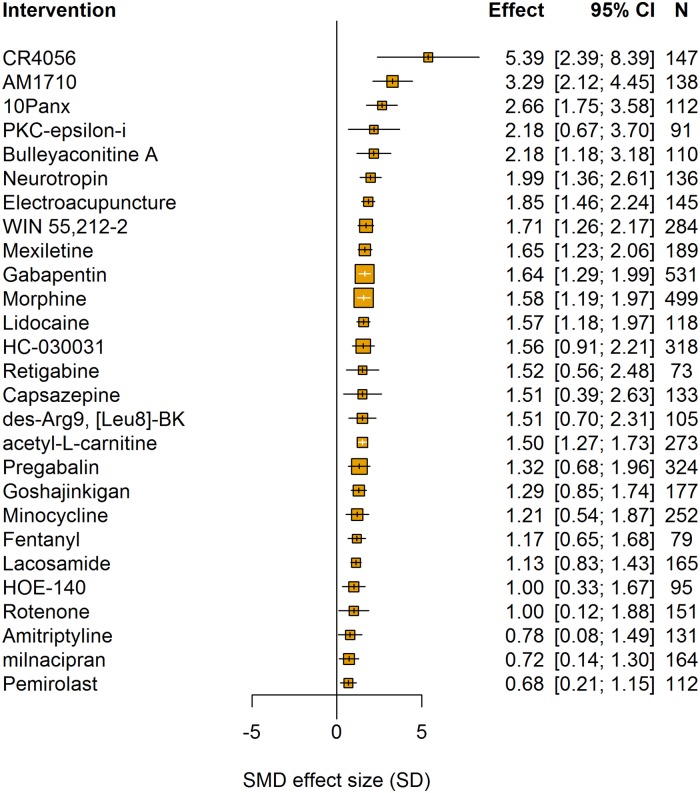
Fig 9. Intervention accounted for a significant proportion of the heterogeneity in intervention experiments using pain-related behavioural outcomes (data set 2a).
Plot shows interventions with 10 or more comparisons. The size of the squares represents the number of nested comparisons that contribute to that data point, and the value N represents the number of animals that contribute to that data point.

