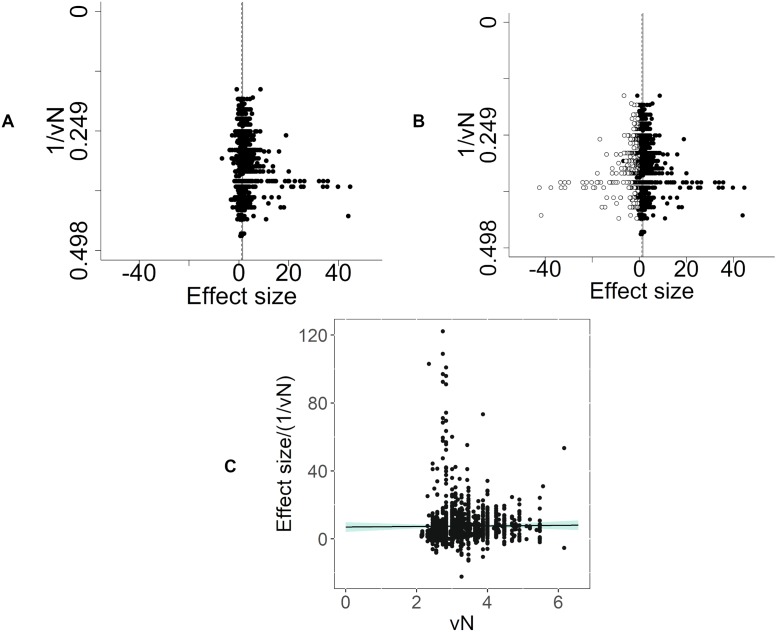
Fig 15. Intervention experiments in which a pain-related outcome was used (data set 2a).
(A) Visual inspection of the funnel plot suggests asymmetry. Filled circles represent reported experiments. Solid line represents global effect size, and dashed line represents adjusted global effect size. (B) Trim and fill analysis imputed theoretical missing studies (unfilled circles). Filled circles represent reported experiments. Solid line represents global effect size, and dashed line represents adjusted global effect size. (C) Egger’s regression indicated small study effects. vN, square root of N.

