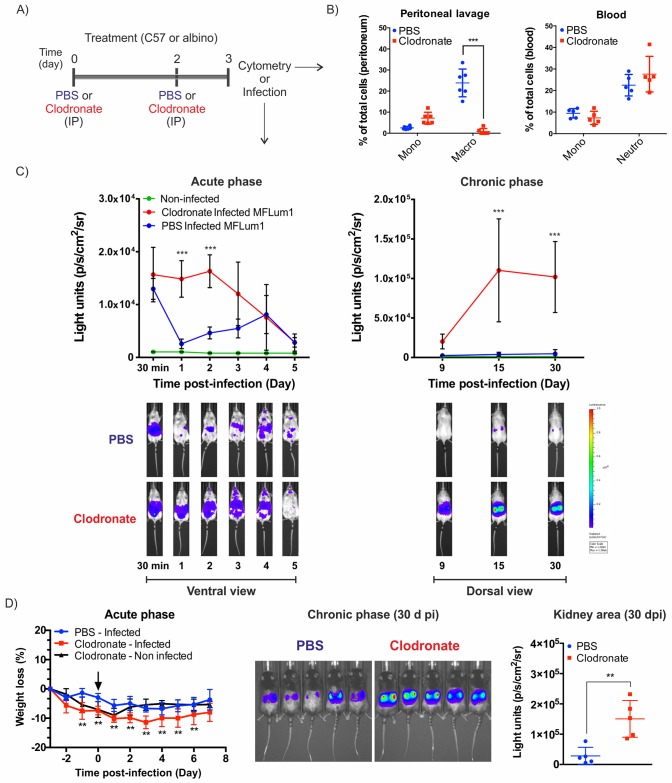
Fig 1. Macrophage intraperitoneal depletion leads to a nonlethal increase in leptospiral burden.
A) Chronogram of macrophage depletion treatment. Mice were injected IP with 100 μL liposomes containing PBS or 5 mg/mL clodronate 3 and 1 days before cytometry analysis or IP infection. B) Flow cytometry analysis and quantification of cell subset changes in the peritoneal lavage and blood of PBS- and clodronate-treated mice (n = 6). Graphs represent the percentage of monocytes, macrophages and neutrophils in the peritoneum and blood (see full gating S1A Fig). C) Live imaging of albino (C57BL/6 B6(Cg)-Tyrc-2J/J) mice treated with PBS- or clodronate-containing liposomes and IP infected with a sublethal dose of 1x10⁷ bioluminescent L. interrogans serovar Manilae strain MFlum1. During the acute phase of infection, the mice were imaged daily (ventral view) from day 0 (30 min post-infection) to day 5. During the chronic phase from day 9, mice were imaged in the dorsal view to measure renal colonization. The lower panel shows a representative example of the follow-up of one mouse. The upper panel shows the quantification of data from n = 5 mice. The blue to red scale is proportional to the intensity of bioluminescence, reflecting the number of live leptospires. D) C57BL/6 WT mice treated with PBS- or clodronate-containing liposomes (n = 5) were IP infected with 5x10⁷ bacteria (MFlum1). Weight variation monitoring expressed as a percentage of the initial weight was used as a marker of acute infection. The black arrow indicates the time of infection. Live imaging during the chronic phase showing renal colonization and quantification 30 days post-infection (dpi) in the kidney area. Curve comparison was performed by 2-way ANOVA comparing PBS vs clodronate at each corresponding time point. * p-value < 0.05; ** p-value < 0.01; *** p-value < 0.001.

