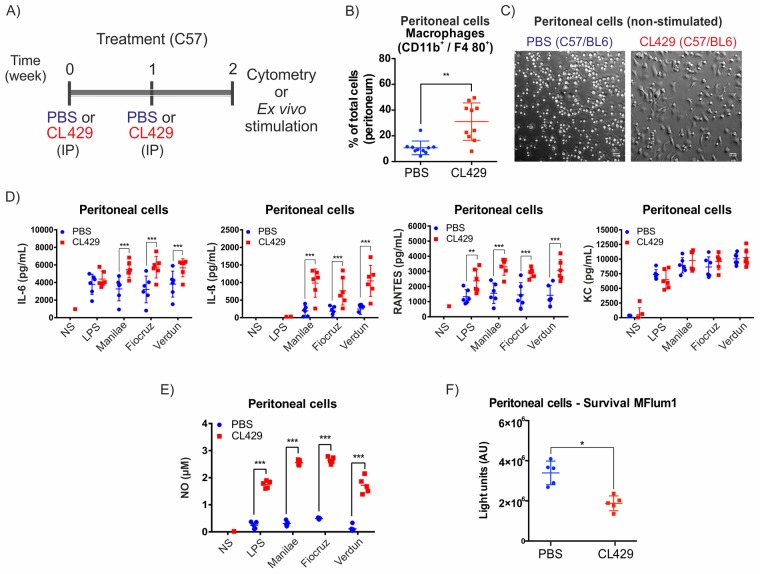
Fig 3. Treatment with CL429 enhances ex vivo antibacterial responses.
A) Chronogram of the experiment. C57BL/6 WT mice were injected IP with 200 μL PBS containing 2.5% DMSO (vehicle) or 25 μg CL429 2 and 1 weeks before the collection of peritoneal cells for cytometry or ex vivo stimulation. Cells were plated, and adherent cells were exposed for 24 h to 100 ng/mL E. coli LPS or live Leptospira interrogans serovar Manilae, Fiocruz or Verdun at a MOI of 100. B) Flow cytometry analysis showing the percentage of macrophages (CD11b+/F4/80+) recovered in peritoneal lavages from treated (CL429) or control (PBS) mice. The plot corresponds to 2 independent experiments pooled with n = 5 mice in each group. C) Representative phase contrast microscopy image of adherent peritoneal cells seeded in 96-well plates at 3 h post-collection (non stimulated (NS) cells). D) Pro-inflammatory cytokine (IL-6, IL-1β) and chemokine (RANTES, KC) production determined by ELISA 24 h post-stimulation in the supernatant of peritoneal cells. Data are representative of 4 independent experiments (n = 4 to 6 mice per group, treated individually). E) Nitric oxide (NO) production in peritoneal cells 24 h after stimulation assessed by the Griess reaction. Data are representative of 4 independent experiments (n = 4 to 6 mice per group, treated individually). F) Peritoneal macrophages were exposed to bioluminescent L. interrogans serovar Manilae MFlum1 strain at MOI of 100. Bioluminescence was measured 24 h post-stimulation in 100 μL culture supernatant to assess the number of live leptospires. Data are representative of 2 independent experiments (n = 5). Statistical analysis was performed by 2-way ANOVA comparing PBS vs CL429 for each stimulation. For macrophage phenotyping (B) and survival (F), statistical analysis was performed by the unpaired t-test. * p-value < 0.05; ** p-value < 0.01; *** p-value < 0.001.

