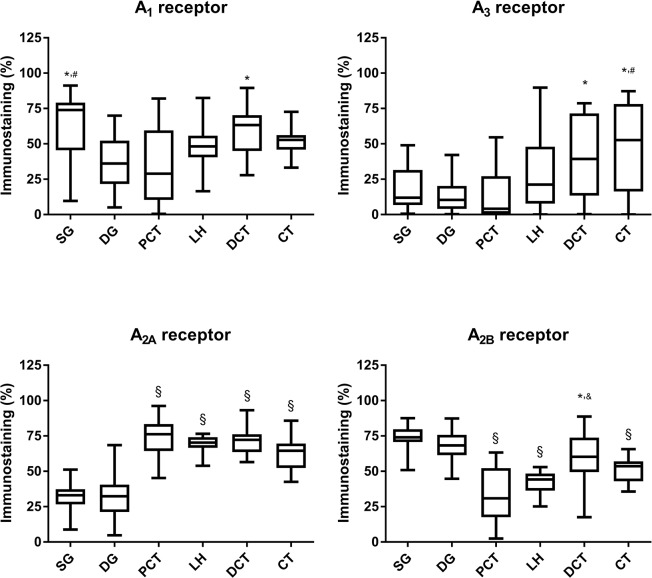
Fig 4. Quantitative immunostaining for A1, A2A, A2B, and A3 adenosine receptors in the renal structures from SHR control rats.
Quantitative analysis of the immunostaining (staining fractional area in percentage of the tissue total area; using the SACAIA method) for the adenosine A1, A2A, A2B, and A3 receptors in the six renal structures from SHR control rats. Superficial (SG) and deep (DG) glomeruli, proximal (PCT) and distal (DCT) convoluted tubule, loop of Henle (LH) and collecting tubule (CT). Values are median and 25th-75th percentiles (P25-P75) from 4 rats. * p<0.05 vs corresponding PCT; # p<0.05 vs corresponding DG; § p<0.05 vs corresponding SG and DG; & p<0.05 vs corresponding LH.

