
Figure 3. Conservation of gene co-expression modules across species and model system.
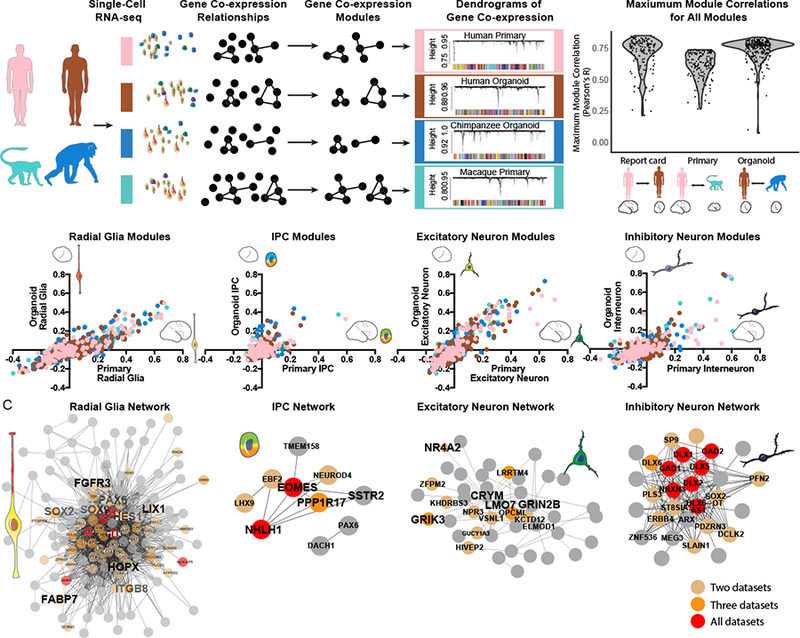
a) Gene co-expression relationships were determined independently in each dataset using WGCNA. Violin plots indicate the distribution of maximum correlation values for all co-expression modules in each pairwise comparison. b) Scatterplots depict the correlation of modules to cell types independently determined in organoid (Y-axis) and primary cell datasets (X-axis). Notably many modules correlate to coarse cell-type classifications, representing finer cell subtypes and states. Dots are colored by the model system in which the network was identified. c) Network maps depict the correlation of genes from top cell type networks across all four datasets. Edges represent a correlation with R > 0.25, with edge length inversely related to correlation strength. Brown, orange and red dots highlight genes that appear in the core module for 2, 3 and 4 networks respectively.