
Figure 6. Human outer subventricular zone radial glia show increased phosphorylation of the mTOR effector S6 compared to other primates.
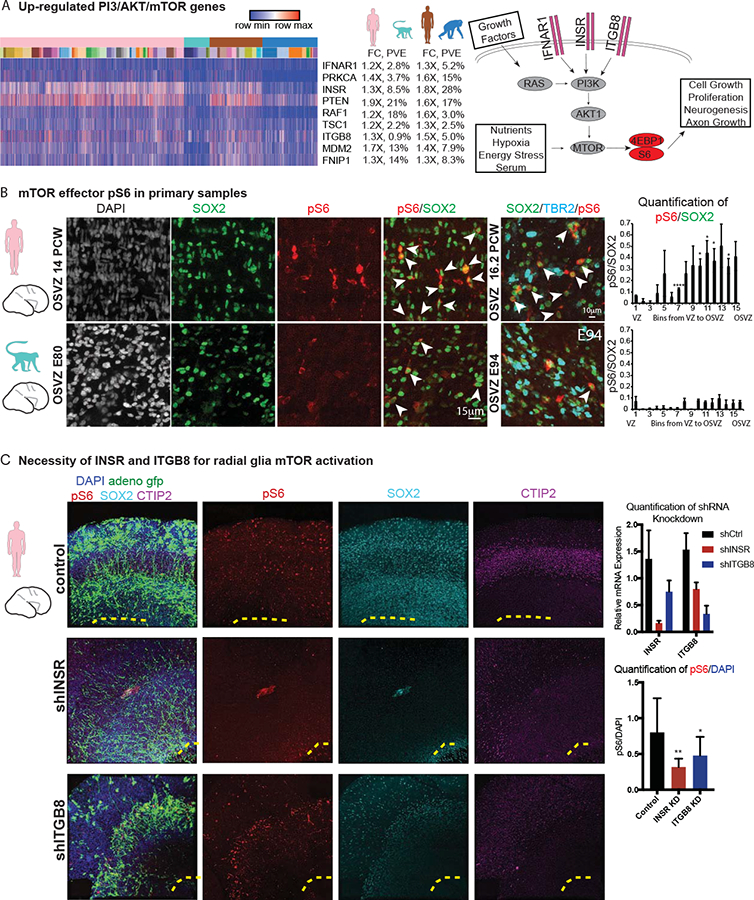
a) Heatmap across all cells (columns) illustrating differential expression for a subset genes related to the PI3K/AKT/mTOR pathway, with label showing the log2(fold change) and percent variance explained by species in both the primary cell and the organoid cell comparison. Schematic highlights receptors upregulated in human and their relationship to downstream effectors, phosphorylated S6 (pS6) and phosphorylated 4EBP1 (p4EBP1). b) Immunohistochemistry illustrates abundant labeling of pS6 in radial glia of primary human outer subventricular zone compared to primary macaque. Quantification of the levels of pS6 is shown in equal bins across the ventricular and outer subventricular zone. * denotes significant up-regulation in human compared to macaque with p <0.05 (*) or p <- 0.0001 (****) in each bin, with aggregated across bins significant at p < 10−6 (Welch’s t-test). c) Immunohistochemistry in human slice culture (representative example, n = 4) shows the fiber architecture (adeno GFP), pS6, SOX2 (progenitor population), and CTIP2 (neuronal population) in slices treated with hairpins targeting INSR or ITGB8. Quantification of knockdown and pS6 levels in outer subventricular zone is also shown. Note the control sample also contains pS6 in the cortical plate as previously observed. * indicates significant downregulation of pS6 levels with p < 0.05 (*) or p < 0.01 (**) (Welch’s t-test).