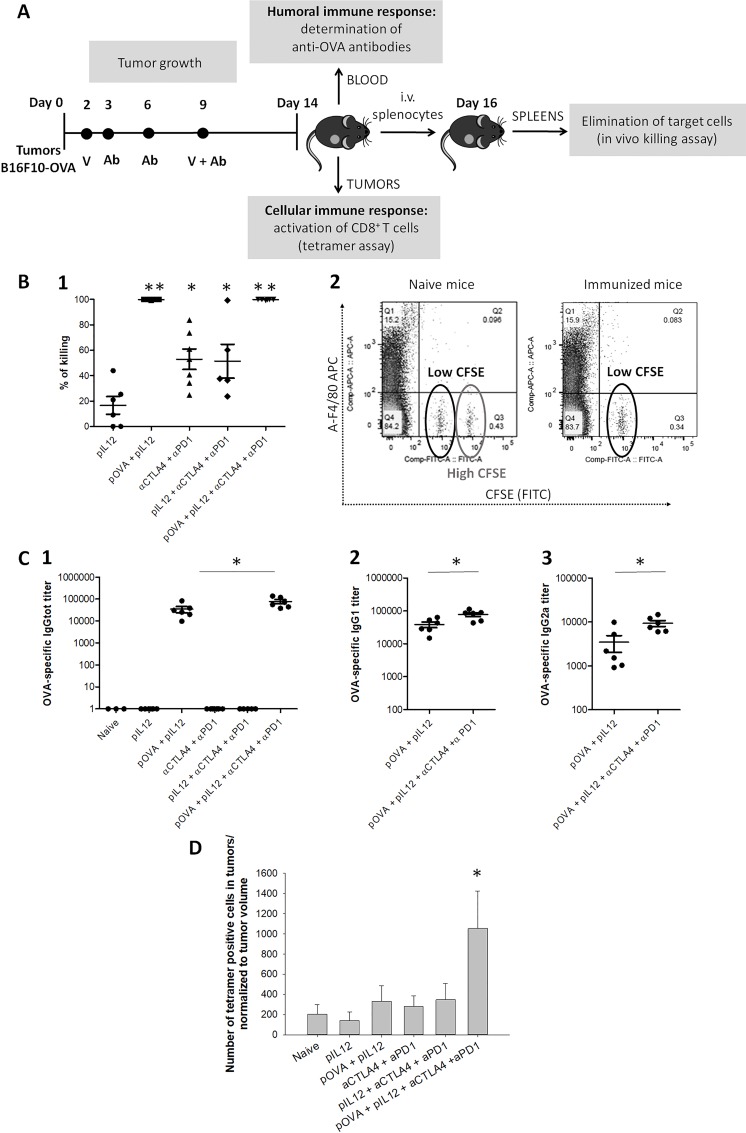
Fig 2. Antigen-specific immune response in B16F10-OVA tumor-bearing mice.
(A) Time-line of the experiment with exact time points for the administration of DNA vaccine or immune checkpoint inhibitors. (B) In vivo killing assay; (1) Percentage of the killing of target cells. *statistically significant difference compared to the naïve group, ** statistically significant difference compared to all other groups. (2) Flow cytometry analysis presenting 2 separated peaks for low CFSE concentration and high CFSE concentration. In naïve mice, which were unable to eliminate target cells labeled with CFSE (FITC), both peaks are present. In mice immunized with pOVA vaccine, which completely eliminated target cells previously labeled with CFSE, the peak for high CFSE is absent. (C) IgG titers in serum samples; (1) Total anti-OVA IgG titer. (2) Anti-OVA IgG1 titer in immunized mice. (3) Anti-OVA IgG2A titer in immunized mice. *statistically significant difference between both marked experimental groups. (D) A number of tetramer-positive CD8+ T cells in tumors normalized to tumor volume. *statistically significant difference compared to the naïve group. Error bars indicate SEM. N = 7 mice per experimental group.

