
Figure 4: TTC staining of brains in sonothromboysis study groups.
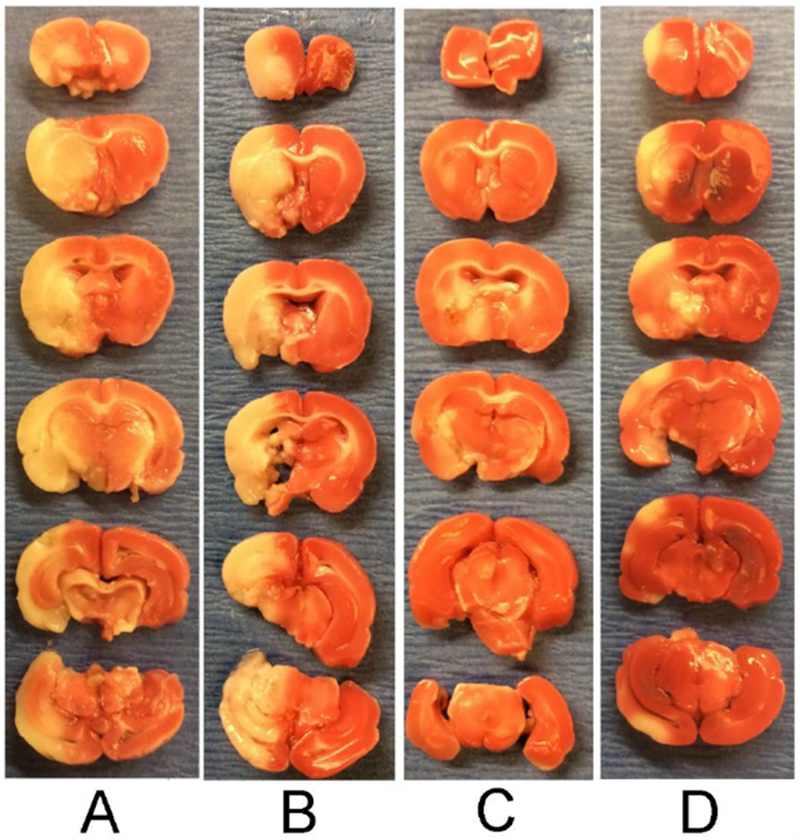
Infarct is identified by pale colored areas. These TTC brain cross-sections are representative results of animals in the control group (A), low-dose rtPA group (B), high-dose rtPA group (C), and sonothrombolysis plus low-dose rtPA group (D). Note less infarction between group B and D despite receiving the same dose of intravenous rtPA.