
Figure 5: Boxplots of outcomes of the sonothrombolysis study.
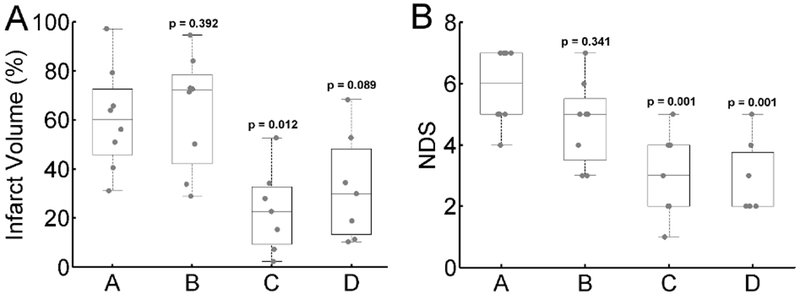
A) Infarct volume across study groups and B) neurological deficit scores across study groups. p-values denote the comparison between the control group (Group A) and each of the other groups. Additional, p values for other comparisons are listed in the results section.