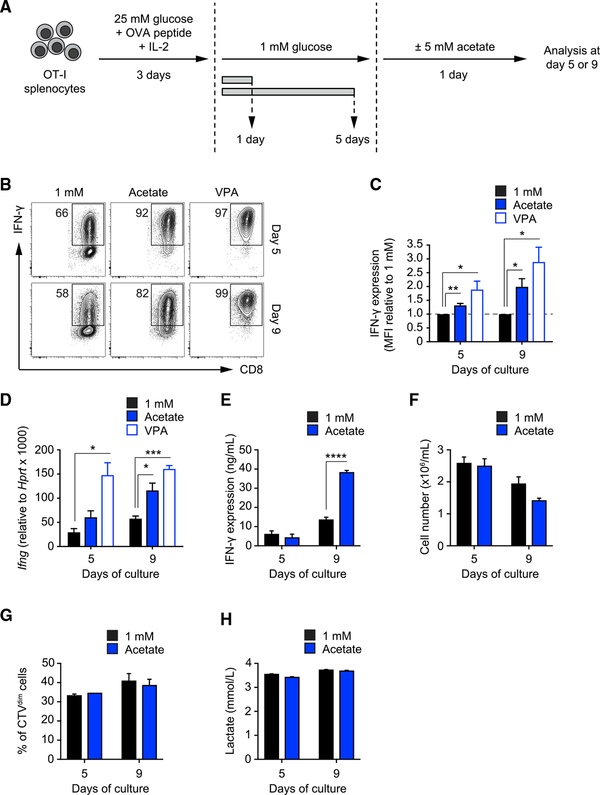
Figure 1. Supplemental Acetate Promotes IFN-γ Production in T Cells under Chronic Glucose Restriction.
(A) In vitro culture system. Splenic naive OT-I CD8+ T cells were activated with SIINFEKL peptide and IL-2 and maintained for 3 days in medium containing 25 mM glucose. Then T cells were transferred to medium containing 1 mM glucose for an additional 1 or 5 days. 1 day prior to analysis, T cells were treated with or without 5 mM acetate. Analysis was performed on days 5 and 9.
(B) FACS analysis of IFN-γ production by T cells cultured as described in (A). Numbers show percentages of IFN-γ+ cells. VPA, valproic acid. FACS plots are representative of n = 4 independent experiments.
(C) Quantification of IFN-γ production as mean fluorescent intensity (MFI) of the CD8+ population. Values were normalized to the 1 mM condition. Mean ± SEM, Student’s t test, n = 4 independent experiments.
(D) Real-time PCR of Ifng mRNA in cells cultured as described in (A). Values were normalized to Hprt. Mean ± SEM, Student’s t test, n = 3 independent experiments.
(E) ELISA quantification of IFN-γ production by T cells cultured as described in (A) upon restimulation of 106 cells with PMA-ionomycin for 4 h. Mean ± SEM, Student’s t test, n = 3 independent experiments.
(F) Number of live cells harvested after 24 h of culture under the indicated conditions after seeding 106 cells/mL. Mean ± SEM, n = 2 independent experiments.
(G) Analysis of cell proliferation using CellTrace Violet dye. The graph shows the fraction of cells diluting the dye over 24 h of culture under the indicated conditions. Mean ± SEM, n = 2 independent experiments.
(H) Quantification of lactate production as a measure of aerobic glycolysis in the medium of cells cultured for 24 h under the indicated conditions. Mean ± SEM, n = 2 independent experiments.

