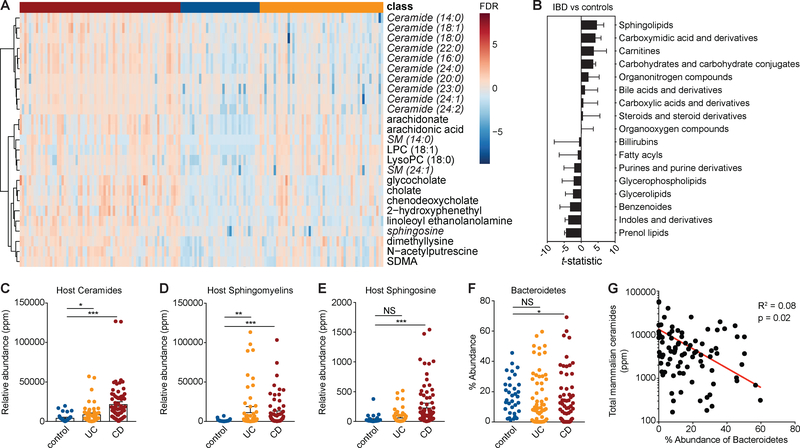
Figure 1: Increased abundances of host-produced sphingolipids is the most significant metabolite signature in stool during IBD.
(A) A clustered heat-map (Pearson-ward) displaying the 25 most significantly increased metabolites in Crohn’s disease (CD), ulcerative colitis (UC) and non-IBD control stool samples. Red indicates increased and blue indicates decreased relative abundance for each metabolite (rows) and sample (columns). Metabolites classified as sphingolipids are in italics. (B) A list of all 512 metabolites identified in the stool of IBD subjects and non-IBD controls, collapsed into 17 classes using metabolite class identifiers from the Human Metabolome Database. The x-axis indicates the change in the t-statistic for each metabolite class in IBD versus control samples. The relative abundance of host-produced (C) ceramides, (D) sphingomyelins and (E) sphingosine was summed and displayed in box-plots. Relative abundance (ppm) was quantified in UC (yellow), CD (red) and control stool (blue). (F) The total percentage abundance of Bacteroidetes strains identified in controls (blue), CD (red) and UC (yellow) was plotted for each individual in the study. (G) The total abundance of annotated mammalian ceramides was plotted against the total percentage abundance of Bacteroidetes species in each control and UC sample. Correlation and statistical regression analysis was performed using Pearson’s method. Statistical significance in (A) and (C-F) was determined by analysis of the FDR by the Hochberg-Benjamini test. *FDR<0.05; **FDR<0.01; ***FDR<0.001; NS, not significant. See also Figure S1 and Data File S1.

