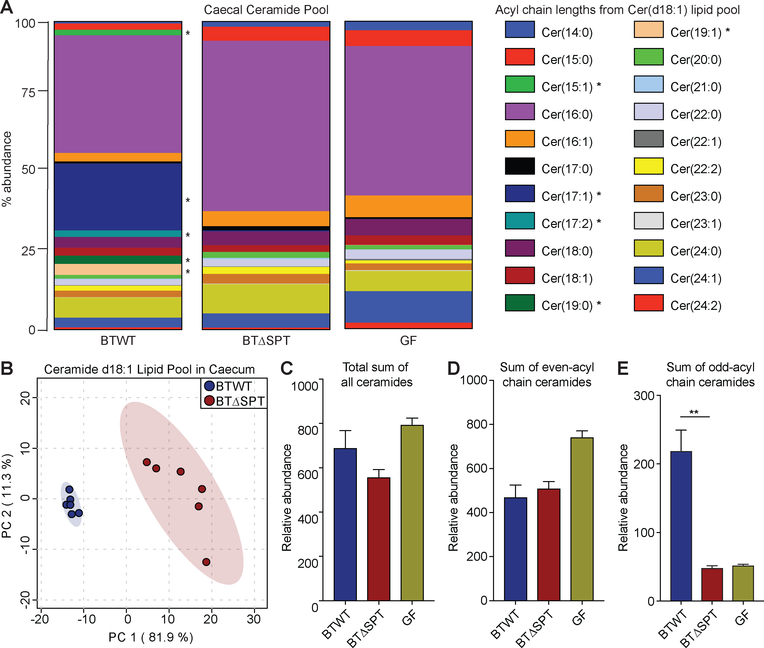
Figure 4: B. thetaiotaomicron mono-colonization significantly alters the host ceramide pool.
(A) Normalized relative abundances (% of total) of all annotated host ceramides with a d18:1 backbone found in caecum of BTWT-colonized (left), BTΔSPT-colonized (middle) or GF (right) mice. Colors represent a unique lipid acyl chain annotated based on a d18:1 backbone. Asterisks denote lipids with significant changes. (B) Principal component analysis (PCA) was performed on the total ceramide d18:1 pool of acyl-chains presented in (A) from BTWT- (blue) and BTΔSPT-colonized (red) mouse caecum. The component change between each sample was plotted and values recorded on the x- and y-axes for percentage change. Mouse caecal samples from each group clustered within the 95% confidence intervals (blue and red shading). (C) Log-transformed relative abundance of all annotated host ceramides found in caecum of BTWT-colonized (blue), BTΔSPT-colonized (red) or GF (green) mice. Each ceramide with an (D) even-acyl or (E) odd-acyl chain length in the caecum of BTWT-colonized (blue), BTΔSPT-colonized (red) or GF (green) mice was summed and plotted, with the y-axis denoting the relative abundance of each observed metabolite detected. All data are representative of 2 independent experiments, n=6 for BTWT- and BTΔSPT-colonized mice and n=2 for GF mice. Statistical analysis in panels (A, E) was determined by the Hochberg-Benjamini test. *FDR<0.05; **FDR<0.01. Error bars are +/− SEM. See also Figure S4 and Data Files S3 and S4.

