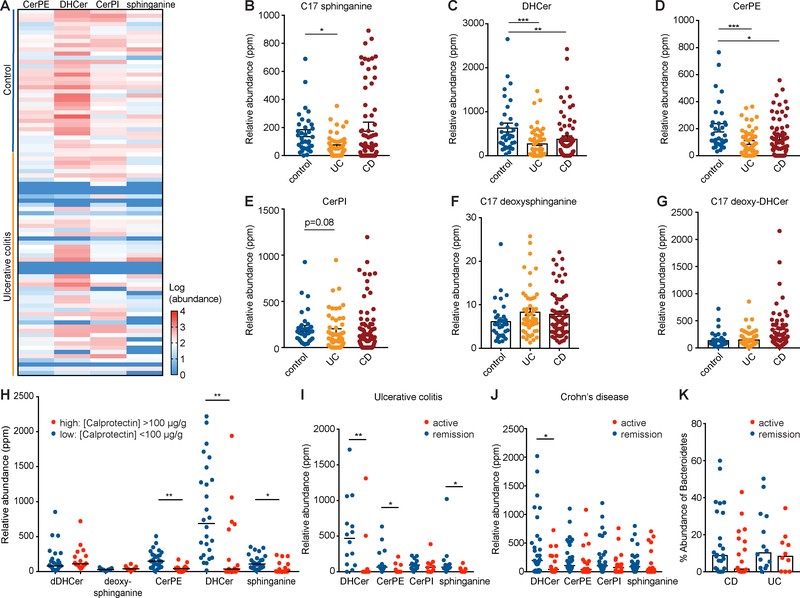
Figure 7: Bacteroides sphingolipids are significantly decreased during IBD and negatively correlated with intestinal inflammation.
Relative abundances of Bacteroides-produced sphinganine, DHCer, CerPE, and CerPI were quantified in stool of ulcerative colitis (UC), Crohn’s disease (CD), and non-IBD control subjects. (A) A heat-map displaying the relative abundances found in UC and control samples. Red indicates increased and blue indicates decreased relative abundances for each sample (rows) and metabolite (columns). Relative abundances in control (blue), UC (yellow), and CD (red) stool are shown for (B) C17 sphinganine, (C) DHCer, (D) CerPE, (E) CerPI, (F) C17 deoxysphinganine, and (G) C17 deoxy-DHCer. (H) The relative abundance of each of these sphingolipids was stratified by low-grade inflammation (fecal calprotectin <100 μg/g; blue) and high-grade inflammation (fecal calprotectin >100 μg/g; red). Bacteroides sphingolipid abundances in (I) UC or (J) CD were further stratified by active disease (Harvey-Bradshaw index >3 for CD and SCCI index >5 for UC; red) or remission (blue). (K) The corresponding percentage abundance of Bacteroidetes by metagenomic analysis was plotted to compare samples from patients with active disease versus those in remission. Statistical significance in panels (B, C, D) was determined by analysis of the FDR (*FDR<0.05; **FDR<0.01; ***FDR<0.001). Statistical analysis in (H, I, J, K) was performed using the Mann-Whitney U-test (*p<0.05; **p<0.01). Error bars are +/− SEM. See also Figure S7 and Data File S1.

