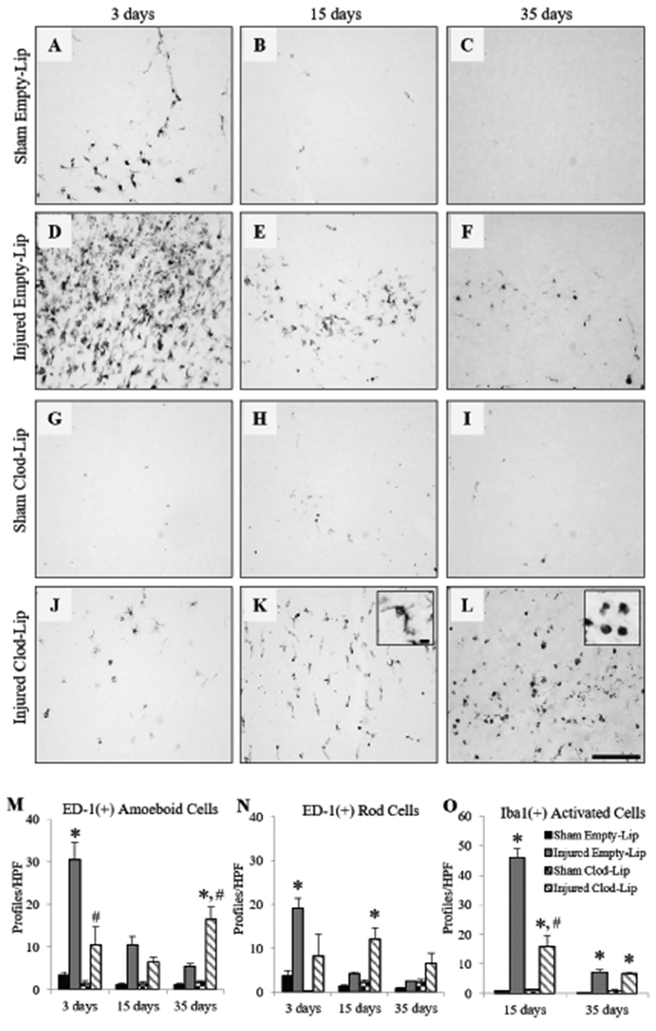
Figure 2. Microglia activation in the cortex following clodronate-induced depletion.
Representative photomicrographs of ED-1 immunoreactivity in sham- (A-C) and brain-injured (D-F) animals injected with empty liposomes and sham- (G-I) and brain-injured (J-L) animals injected with clodronate liposomes at 3 (A,D,G,J), 15 (B,E,H,K), and 35 (C,F,I,L) days post-injury. Inset in Fig. K shows a representative photomicrograph of a rod microglia/macrophage characterized by an elongated, thick cell body and short processes. Inset in Fig. L shows a representative photomicrograph of an amoeboid microglia characterized by a round cell body and few, if any, visible processes. Quantification of ED-1(+) microglia exhibiting amoeboid (M) and rod (N) morphologies. Quantification of Iba-1(+) cells exhibiting activated morphology as described in Methods (O). Bar graphs represent group means and error bars represent the standard error of the mean. *, p≤0.05 compared to time-matched sham-injured group; #, p≤0.05 compared to time-matched brain-injured empty liposome-injected animals. Scale bar in L = 100μm for all panels; scale bar within the inset in panel K = 10μm for both inset micrographs.

