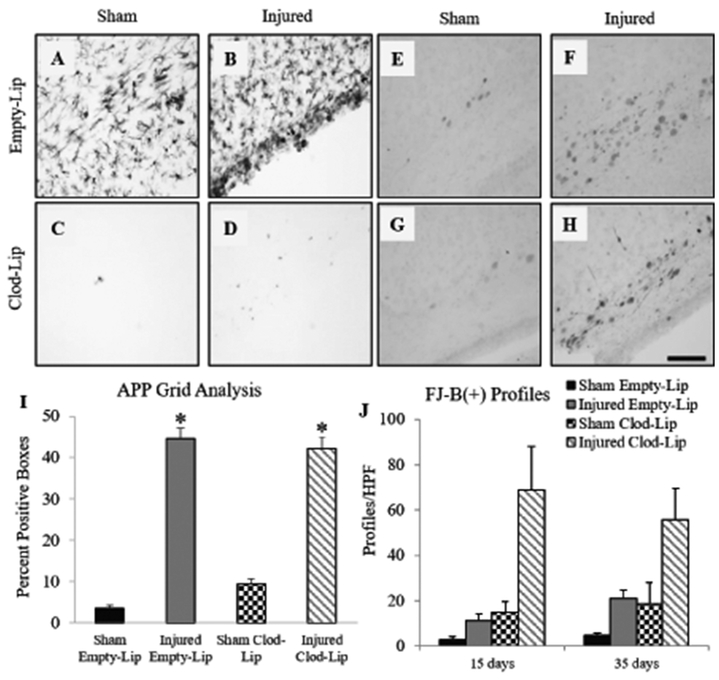
Figure 5. Pathologic alterations in the white matter following clodronate-induced microglia depletion.
Representative photomicrographs of Iba-1(+) microglia at 3 days post-injury in the white matter tracts below the impact site of sham- (A) and brain-injured (B) animals injected with empty liposomes and sham- (C) and brain-injured (D) animals injected with clodronate liposomes. Representative photomicrographs of APP(+) profiles at 3 days post-injury in sham- (E) and brain-injured (F) animals injected with empty liposomes and sham- (G) and brain-injured (H) animals injected with clodronate liposomes. (I) Quantification of the extent of APP labeling using the grid analysis described in the methods. (J) Quantification of FJB(+) profiles. Bar graphs represent group means and error bars represent the standard error of the mean. *, p≤0.05 compared to corresponding sham-injured group. Scale bar in panel H = 100μm for all panels.

