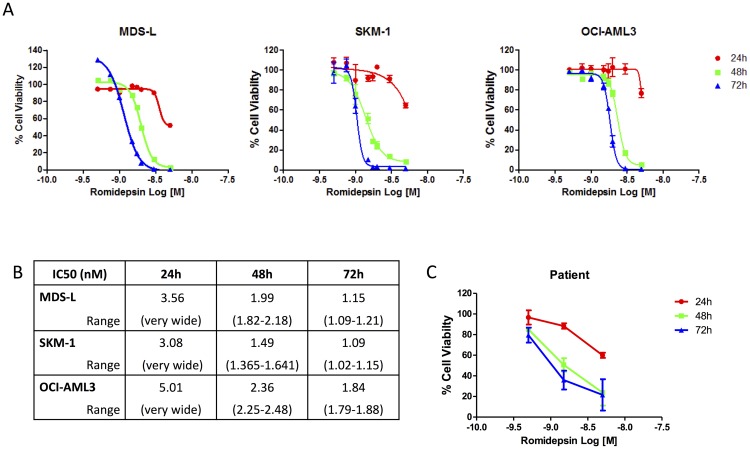
Figure 1. Dose dependent response of Romidepsin in cell lines and patient samples.
(A) OCI-AML3, SKM-1 and MDS-L cell lines treated with a dose range of Romidepsin with cell viability being assessed using the Cell Titer Glo® Assay at 24, 48 and 72 hours. IC50 values were determined based on cell line and time using GraphPad Prism software. (B) IC50 (nM) and range for Romidepsin for the three cell lines at each time point (24 hr, 48 hr and 72 hr). (C) Romidepsin treated patient samples over 24, 48 and 72 hours showing dose and time dependent reduction in cell viability following treatment as measured using Cell Titer Glo®.

