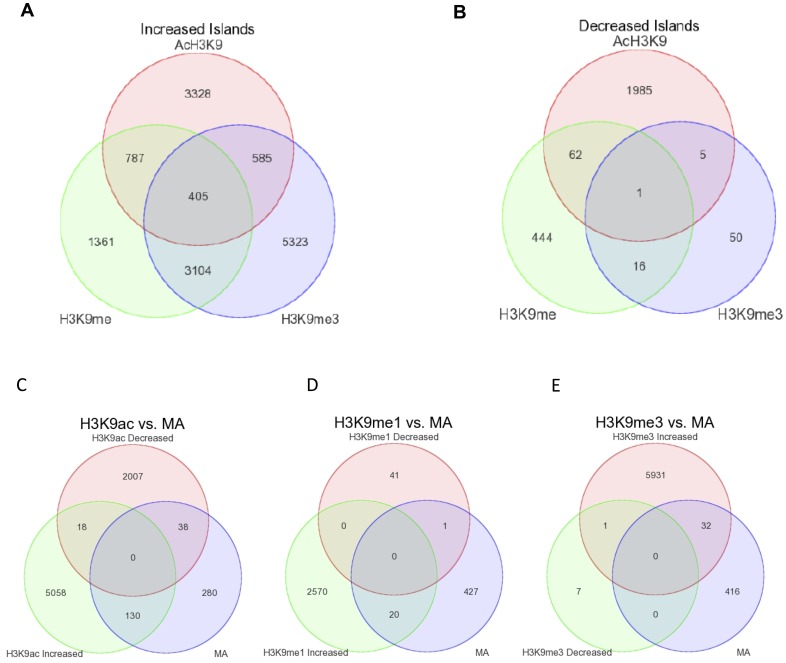
Figure 4. Overlap in genes regions associated with increased and decreased islands across all three histone marks and differentially expressed genes.
Gene regions associated with increased and decreased islands generated in SICER were imported to Partek for overlap analysis. Overlap of positional enriched regions showing increased (A) or decreased (B) acetylation/methylation for the three marks. Overlap of differential histone marks and differentially expression genes by microarray for H3K9ac (C), H3K9me (D) and H3K9me3 (E).

